Hi, Im Felipe Herrera
Data Analyst with a strong background
in UX/UI Design, Motion Graphics, and Video Editing.
Passionate about leveraging data-driven insights to optimize user experiences, improve decision-making, and drive company growth while achieving corporate objectives.

Motion Portfolio
Hey!
Take a look at these examples of my Motion Graphics & Video Editing work.

SHOWREEL
Motion Graphics
Video Editing
Data Analysis Portfolio


Some of the tools that I use


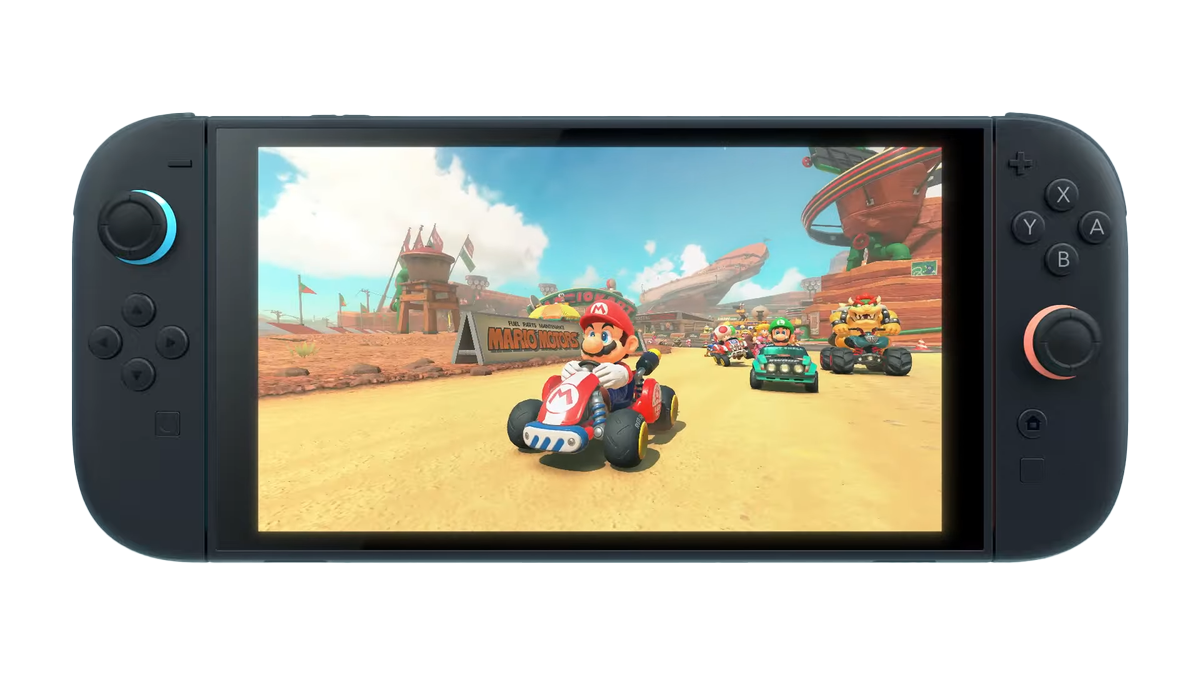
Nintendo Switch Sales Analysis:
Predicting the Success of Nintendo Switch 2
Role
Data Analyst:
What
Sales Predictions & Market Analysis
Category
Gaming Industry
Why
Independent Research
When
February 2025
Introduction
The Nintendo Switch 2 is set to launch in 2025, and expectations are high. For it to be deemed a success, it must surpass the sales of Nintendo’s best-performing consoles: the Nintendo DS (154M units sold) and the Nintendo Switch (122.55M units sold). This case study analyzes the sales trajectory required for the Switch 2 to achieve this milestone.

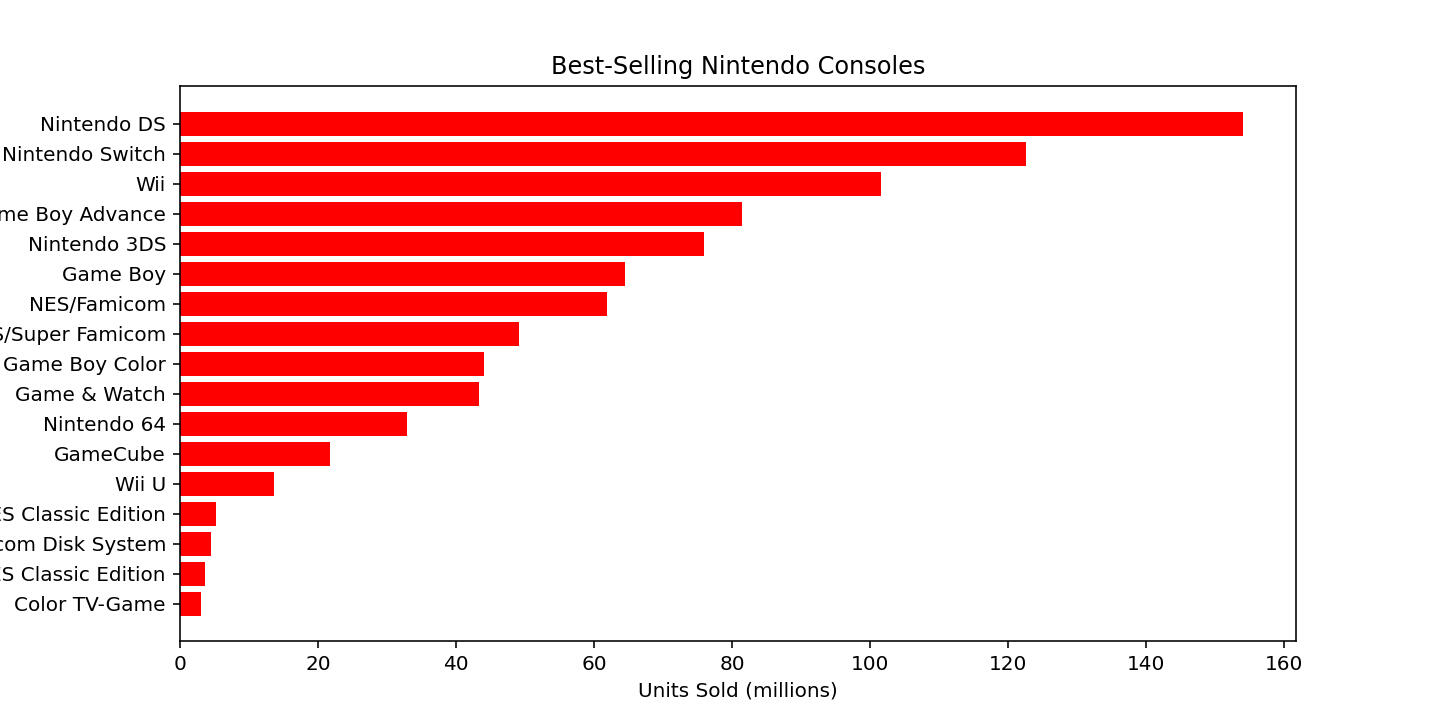
Understanding Past Console Sales
Best-Selling Nintendo ConsolesNintendo DS: 154M units soldNintendo Switch: 122.55M units soldNintendo Wii: 101.63M units soldNintendo 3DS: 75.94M units soldNintendo Game Boy & Game Boy Color: 118.69M units soldBased on this data, the Switch 2 must sell over 155M units to break records and cement its place as a top-selling console.
Methodology
To achieve these objectives, we gathered and analyzed data from three key sources:•Nintendo Switch Sales Data (2017-2024): Used to understand sales trends and forecast potential performance for the Switch 2.•Best-Selling Nintendo Consoles Data: Provided insights into how past consoles performed and where the Switch ranks among them.•Top-Selling Nintendo Switch Games: Helped identify patterns in software sales that could guide future releases for the Switch 2.
Tools Used
•Python (Pandas, Matplotlib, Seaborn) – Data cleaning, analysis, and visualization.
•Excel – Quick calculations and trend identification.
•Tableau – Interactive dashboards and data storytelling.
Data
Sales Growth Trends of Past Consoles
To estimate the sales needed, we examined the cumulative sales trends

Required Sales Trajectory for Switch 2
To exceed 155M units, the Switch 2 must maintain strong yearly sales over 6-7
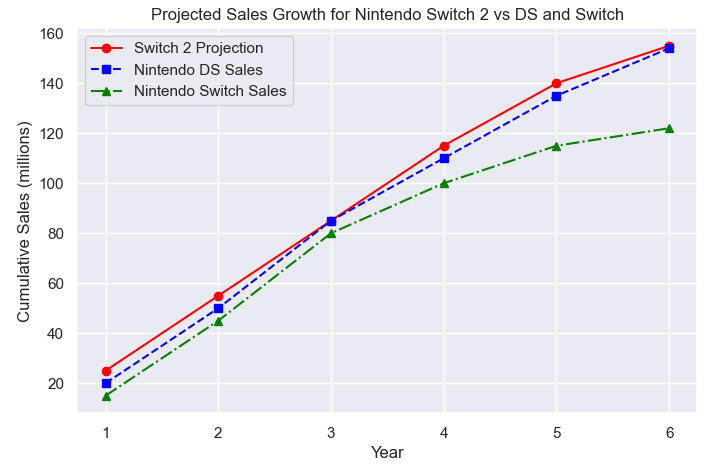
Key Takeaways
•The Switch 2 must sell at least 155M units to surpass Nintendo's best-selling console.•Strong first-year sales (25M+) will be crucial for long-term success.•The sales trend should peak by Year 4 and sustain momentum beyond Year 6.•Game like Mario Kart and Animal Crossing could heavily boost adoption rates.
Best-Selling Games on the Nintendo Switch and Their Impact on Switch 2 Sales

Popular game franchises significantly impact console sales.
Here are the top-selling Nintendo Switch games:
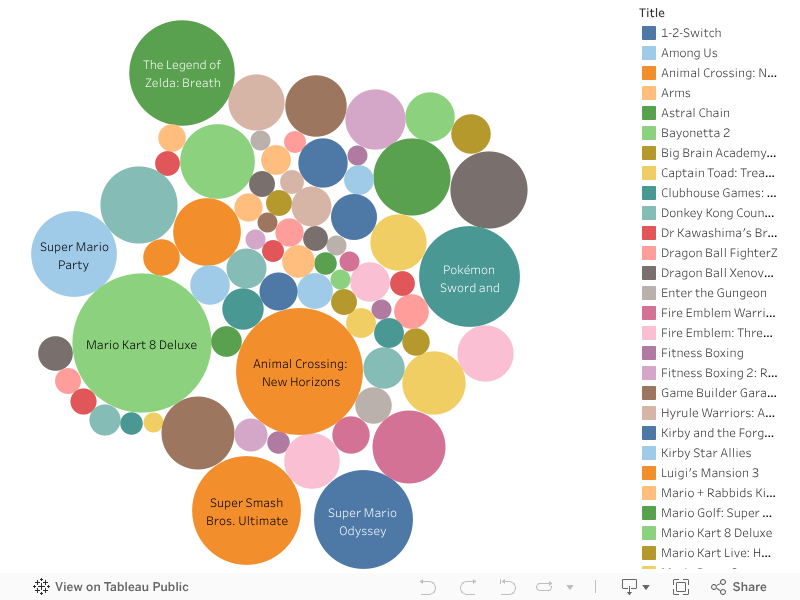
Potential Impact on Switch 2 Sales
If Nintendo releases sequels or enhanced editions of these top-selling games, it could drive early adoption rates for the Switch 2. Possible game releases include:Mario Kart 9: A long-awaited sequel could generate massive initial sales.Animal Crossing: Expanding on the social simulation genre would attract casual gamers.The Legend of Zelda: Tears of the Kingdom DLC or a New Entry: Zelda titles have consistently driven console sales.Super Smash Bros. Ultimate Deluxe: Adding new characters and features could sustain long-term engagement.
Required Sales Trajectory for Switch 2
To exceed 155M units, the Switch 2 must maintain strong yearly sales over 6-7


Key Takeaways
•The Switch 2 must sell at least 155M units to surpass Nintendo's best-selling console.•Strong first-year sales (25M+) will be crucial for long-term success.•The sales trend should peak by **Year 4 **and sustain momentum beyond Year 6.•Game like Mario Kart and Animal Crossing could heavily boost adoption rates.
Final Thoughts
The Nintendo Switch 2 has a challenging but achievable goal ahead. If it can replicate the early momentum of the Switch, while maintaining long-term sales stability, it has the potential to become Nintendo’s best-selling console of all time.

Analyzing Top-Selling Products by Season
Role
Data Analyst:
Category
E-COMMERS
Why
Independent Research
When
February 2025
Introduction
This case study aims to analyze and identify the top-selling products across different seasons using data from product categories, purchase amounts, and other relevant variables. The analysis will help understand which products experience peak sales during specific seasons and provide insights into sales patterns.

Which products sell the most during each season, and how do factors like category, payment method, and location influence sales?
Data Sources
The dataset contains details about product sales, including:•Product Categories
•Purchase Amount (USD)
•Season
•Payment Method
•Customer Information (such as gender and location)
Methodology
The analysis includes:Data Cleaning & Preparation – Cleaning missing values, converting data types, and creating necessary fields for analysis.
Exploratory Data Analysis (EDA) – Examining trends, distributions, and correlations.
Top Products by Season – Identifying which products are top-selling during different seasons.
Data Visualization – Visualizing trends using various graphs to understand the data better.
Data Cleaning & Preparation
Python libraries used:
Load datasets:
Creating Seasonal Sales Data:
Include sales by season to understand how the total purchase amount varies with different seasons.

Exploratory Data Analysis
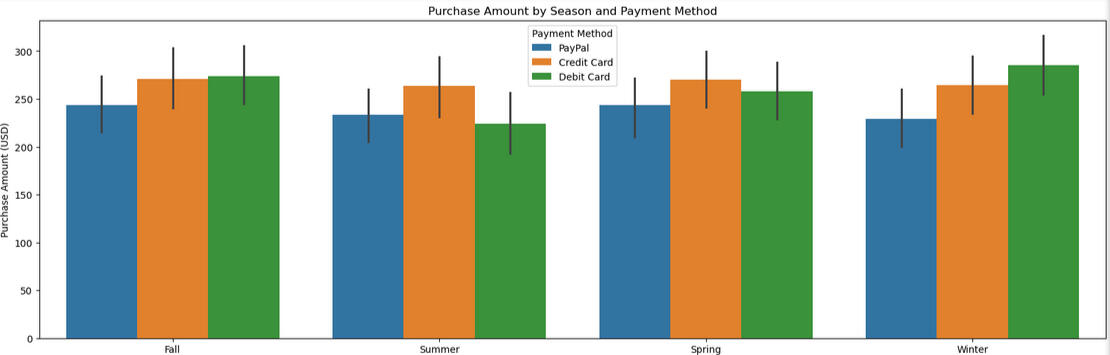
Sales by Season and Payment Method
I create bar plot to visualize sales amounts across different seasons, segmented by payment method:
This graph helps us see which payment methods dominate during different seasons and how sales fluctuate over time.
Total Purchase Amount by Product Category and Season
identify the top-selling products in each season by grouping the data by season and item purchased.

This plot highlights the performance of each product category over time, showing which categories drive the most revenue.

Insights & Conclusion
Seasonal Trends: We can observe that certain products may experience peak sales during specific seasons. For example, winter jackets are likely to sell more in the winter season, while outdoor gear might perform better in the summer.Payment Methods: The data also reveals how different payment methods are used across seasons, with credit card payments likely being more common during high-demand seasons like the holidays.Category Insights: The Category-wise analysis provides a deeper understanding of how different product categories contribute to total sales, highlighting areas with higher demand and sales potential.

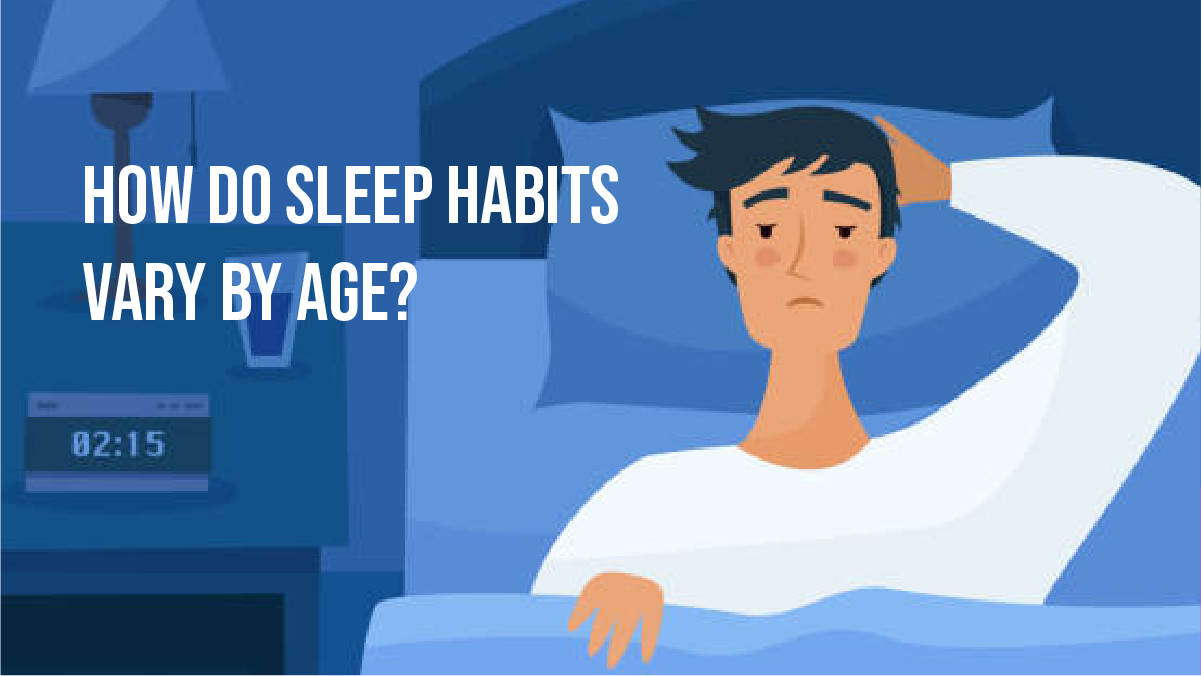
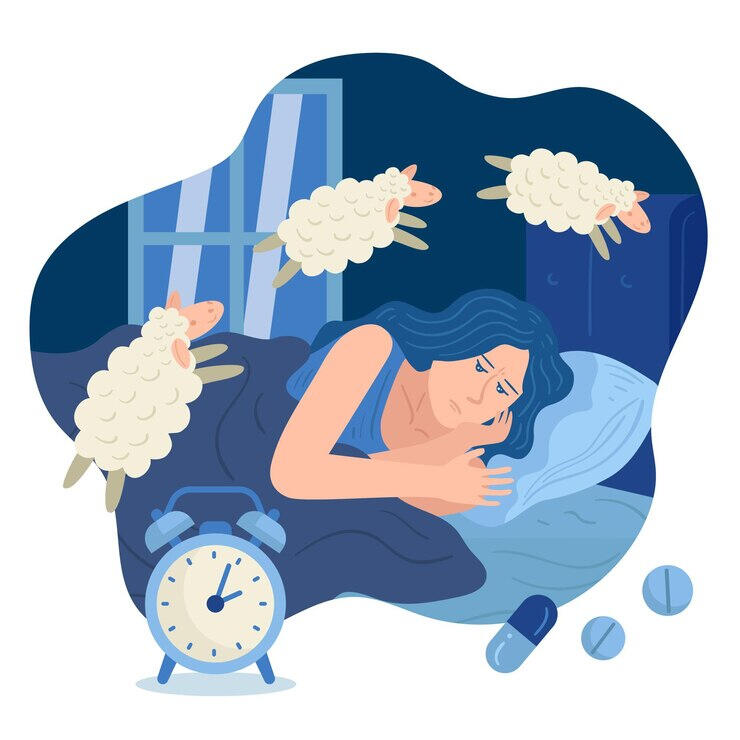
Analyzing Sleep Patterns Across Age Groups:
A Data-Driven Approach
Role
Data Analyst:
What
Analysis
Category
Health
Why
Independent Research
When
February 2025
Introduction
Sleep is a crucial component of overall health and well-being, and its patterns vary significantly across different age groups. This case study aims to analyze how sleep habits change with age using data analysis techniques in Python. We will explore datasets related to sleep efficiency, health, and lifestyle factors affecting sleep. Additionally, we will use visualizations to identify trends and patterns.
How do sleep habits vary across different age groups, and what factors influence sleep efficiency?
Data Sources
The following sources for this analysis:Sleep Foundation and Sleepopolis Articles – Background information on recommended sleep duration by age.Sleep Data – Pre-collected datasets that include:
•Sleep efficiency dataset•Sleep health and lifestyle data•Mental health and sleep-related insights
Methodology
The approach includes:Data Cleaning & Preparation – Loading datasets, handling missing values, and structuring age groups.Exploratory Data Analysis (EDA) – Analyzing distributions, correlations, and visualizing trends.Data Visualization – Creating graphs to illustrate sleep patterns across age groups.Insights & Conclusion – Interpreting results and summarizing findings.
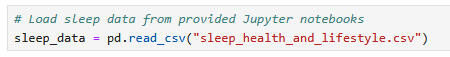
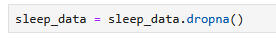
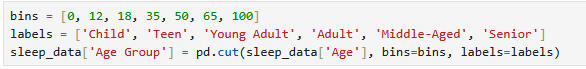
Data Cleaning & Preparation
Python libraries used:

Load datasets:
Handle missing values:
Categorize age groups:
Exploratory Data Analysis
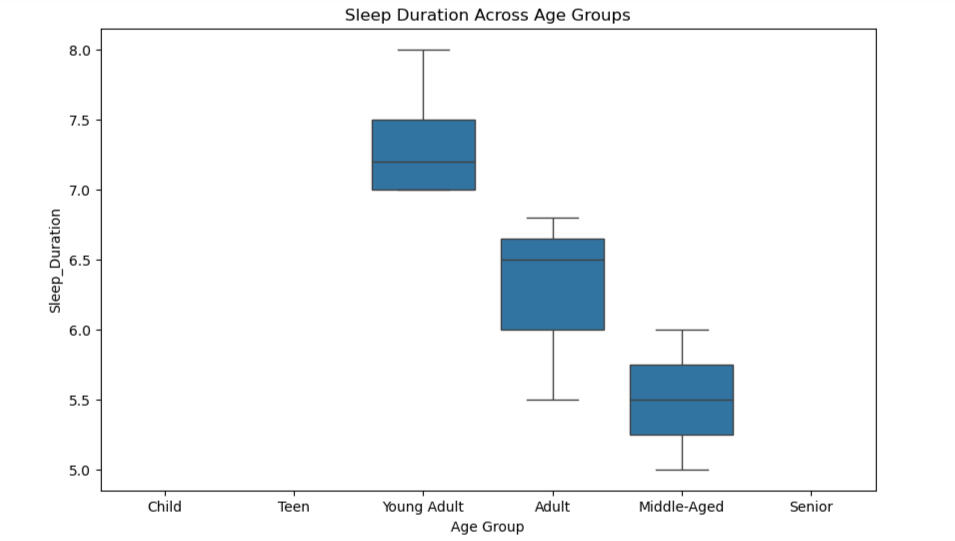
Distribution of Sleep Duration by Age Group:
This box plot shows how sleep duration varies across age groups. The median line inside each box represents the typical sleep duration, while the whiskers indicate the range. Young adults tend to have slightly longer sleep, while middle-aged and older adults show more variability. Outliers suggest that some individuals experience significant differences in sleep duration.


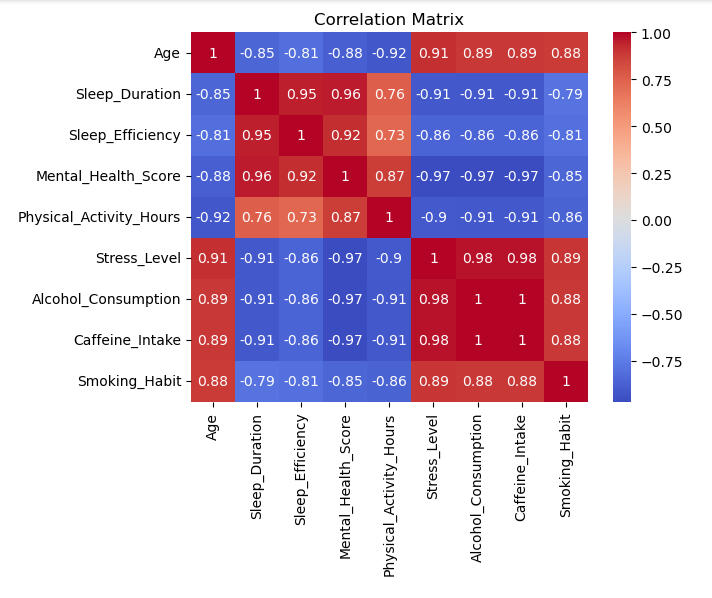
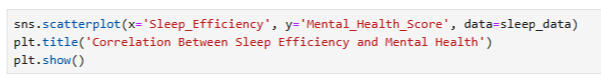
Correlation Between Sleep Efficiency and Other Factors
This heatmap visualizes the correlation between different numeric variables in the dataset. Each square in the matrix shows the correlation coefficient between two variables, with values ranging from -1 (perfect negative correlation) to +1 (perfect positive correlation). A value of 0 indicates no correlation.
Mental Illness & Sleep
Impact of Mental Health on Sleep:•Depression and anxiety often lead to insomnia or hypersomnia.•Sleep deprivation can worsen mental health conditions.Analysis of Mental Health Factors and Sleep
The impact of mental health conditions on sleep. Conditions like depression and anxiety can disrupt sleep patterns, leading to issues like insomnia or excessive sleep. The analysis shows how sleep duration and efficiency differ for individuals with and without mental health conditions. Understanding this relationship is crucial for addressing sleep problems linked to mental health and for developing effective interventions.
Insights & Conclusion
•Children and teens tend to sleep longer, aligning with recommended guidelines.•Sleep duration decreases with age, with middle-aged and senior individuals reporting shorter sleep durations.•Sleep efficiency is influenced by multiple factors such as stress, health conditions, and age.•Mental health plays a crucial role in sleep quality, with individuals suffering from conditions like anxiety and depression experiencing disrupted sleep patterns.
UX/UI Portfolio


Some of the tools that I use


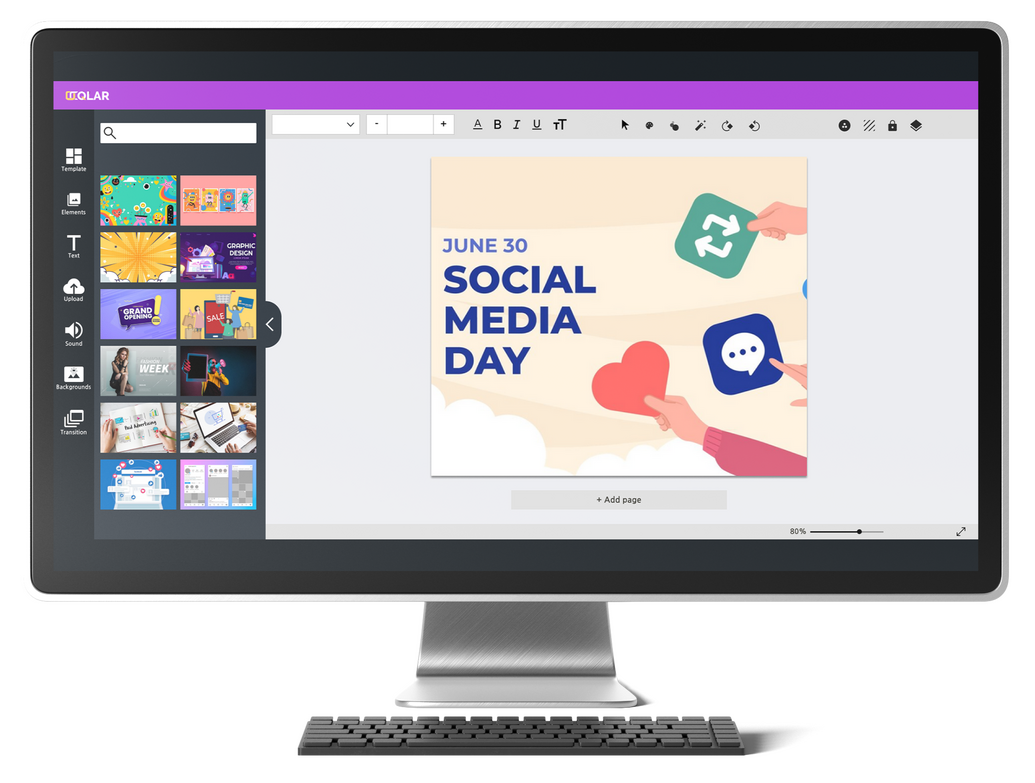
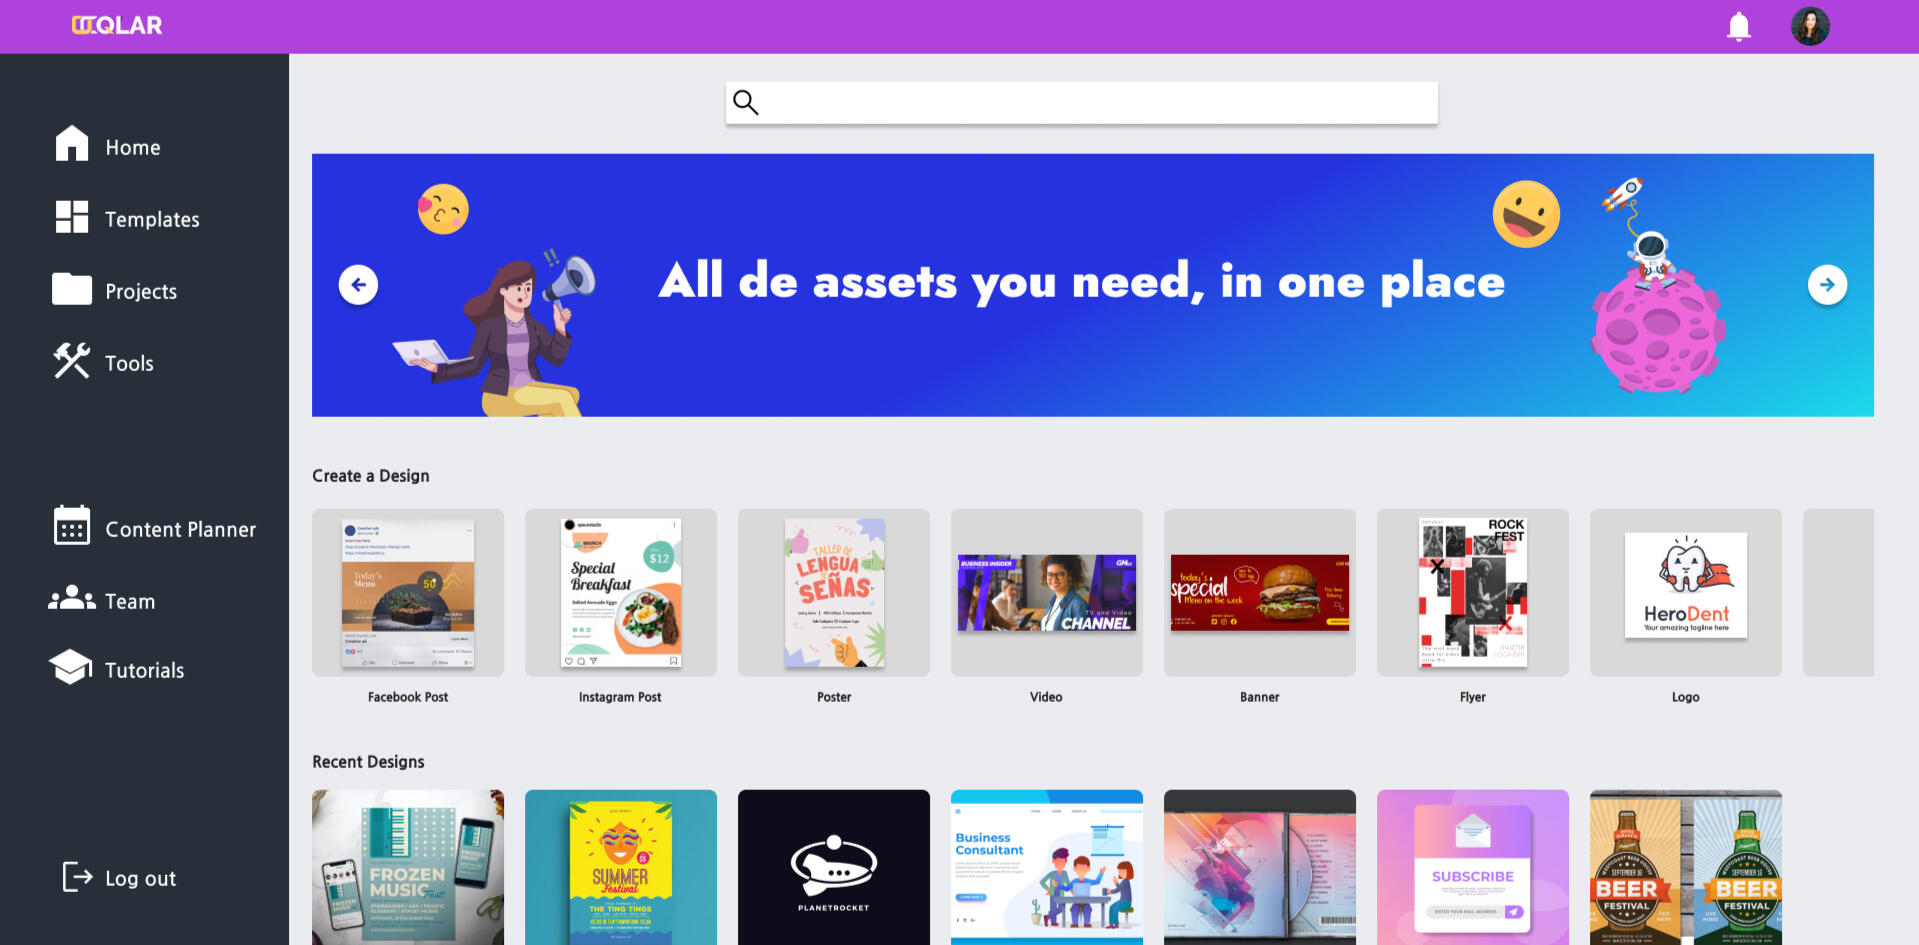
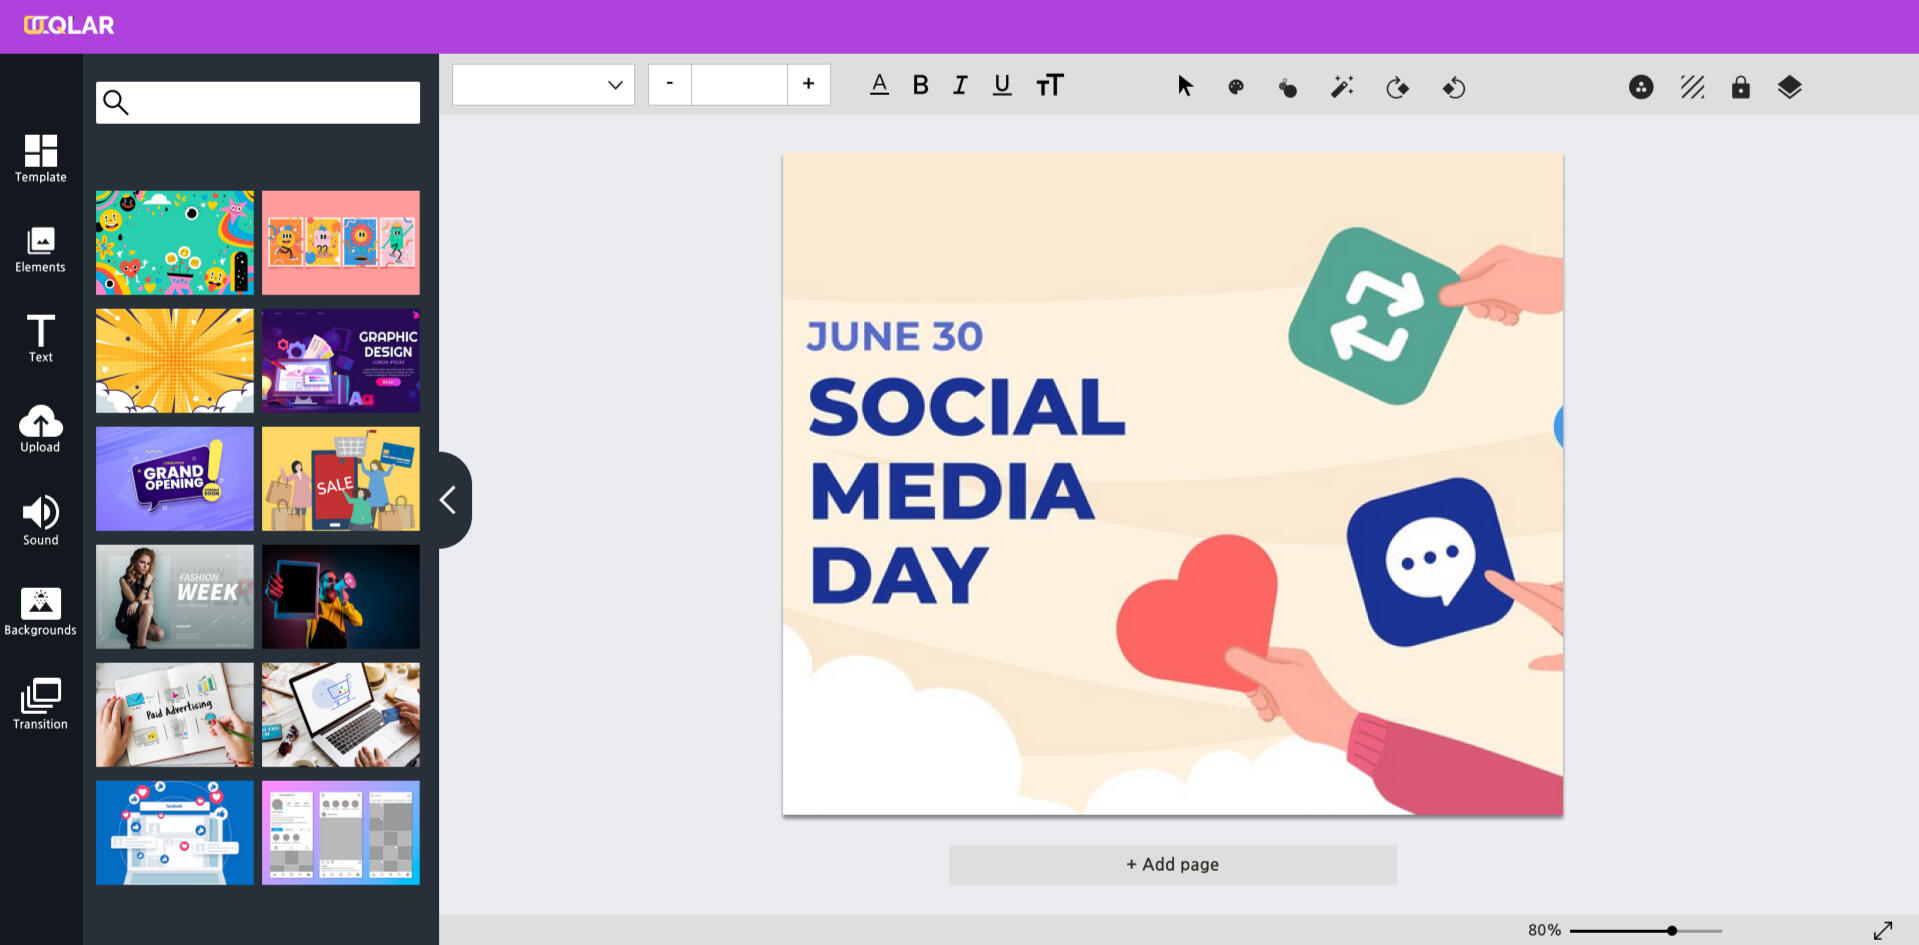
Create stunning visuals in minutes with all-in-one app
OCQLAR
Where
Mexico
Role
Product Designer:
UI & Researcher
What
Software/Website Tool
Category
Graphic Design
and Video Editing tool
Why
Work in a Startup
When
December 2020 - Present
Why we made this project
OCQLAR is a web-based platform that permits clients to effortlessly make professional-looking visuals such as social media design, introductions, and showcasing materials utilizing customizable layouts.Users can create high-quality visuals without requiring advanced planning skills.

Market Research
The Claim
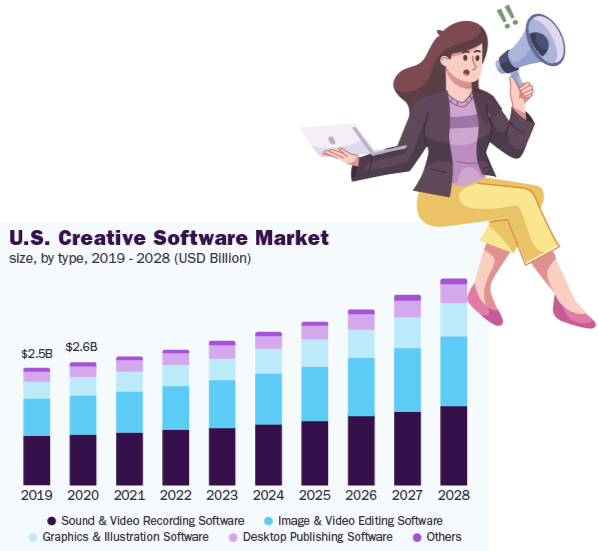
The market for creative software was worth $8.47 billion in 2021, and is expected to grow by 6.8% annually from 2022 to 2028.This growth is driven by the need to distribute audio and video files to many people,the popularity of online video and audio platforms, and the increasing demand for on-demand services.There is also potential for growth in small and medium-sized businesses and the education sector
The Problem
Our fundamental challenge was to form a realistic planning device that's user-friendly and accessible to people with little or no planning experience.We needed to provide clients with a variety of formats that could be easily customized to their specific needs while also ensuring that the software was quick and simple to use.
Competitive Analysis
I conducted an analysis of the most popular free design tools, examining their user flow and available services.I also examined negative comments to identify patterns and gain a deeper understanding of the user experience.

Problems from the comments
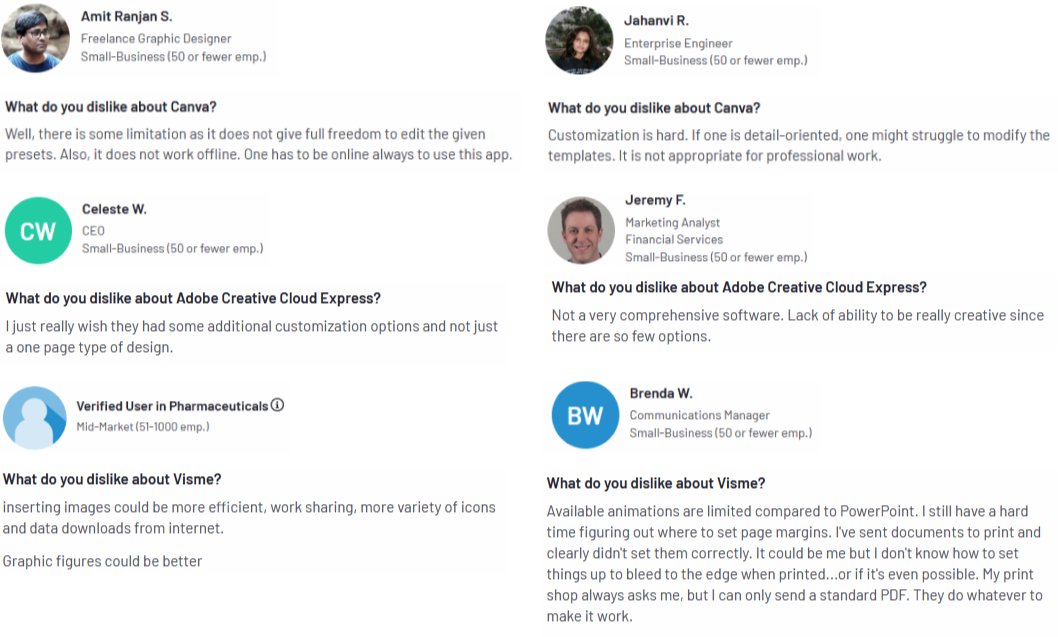
Canva has
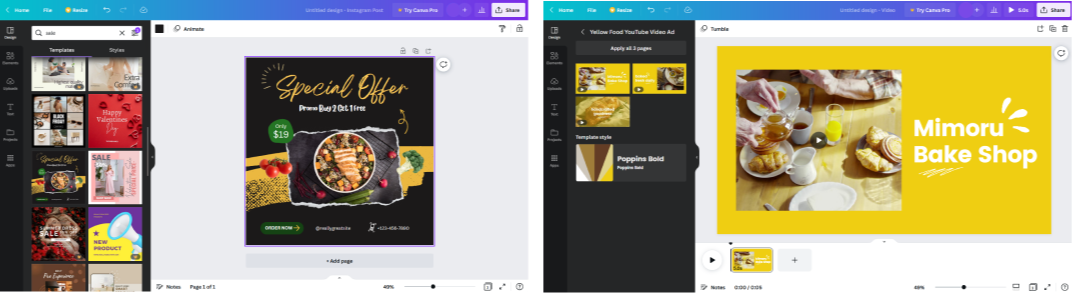
Canva is a popular graphic design tool known for its user-friendly interface, drag-and-drop functionality,
and pre-made templates.
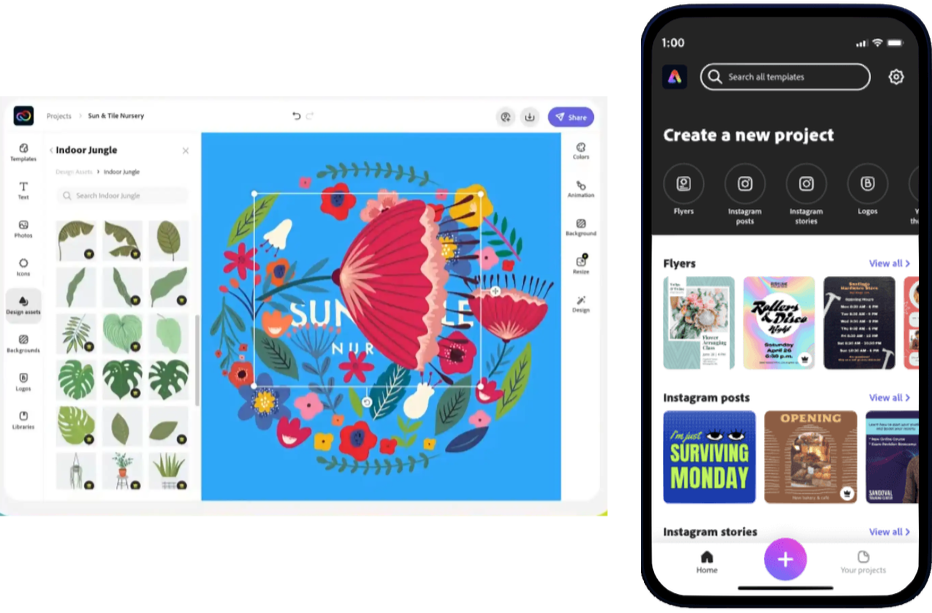
Canva offers a wide range of design elements, such as fonts, images, icons, and templates•Available on web and mobile.
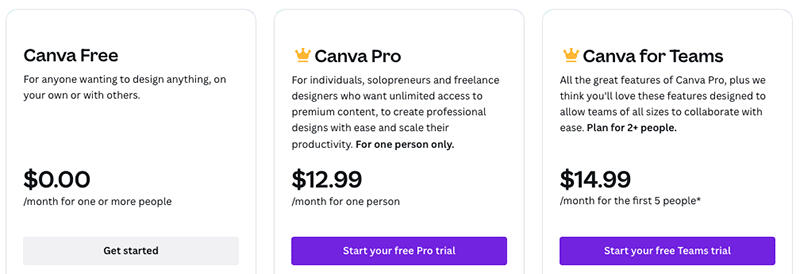
Canva’s Price Points
Adobe Express has
Quickly and easily make stand out content from thousands templates easy to use templates, images and text,
and quickly resize.
•Available on web and mobile.
Adobe Express’s Price Points
User Survey
To meet these challenges, we started by conducting extensive user research and testing to better understand our target audience and their needs.We found that our target audience was primarily made up of small business owners, bloggers,and individuals
who needed to create visuals for their personal or professional projects but lacked design skills.
Data analysis
•34% of Users that use a Design Tool Are 25-34 Years Old
•55% of users are female, and 45% are male
•Over 8 Million Teachers and Students Use a Design Tool
•Approximately 800,000 teams Are paying for a Canva subscription
Initial research shows:
Based on our findings, we had to create a user-friendly interface that was easy to navigate and allowed users to easily customize templates without needing any advanced design skills.We also need to incorporate a wide range of templates that are customizable and flexible, allowing users to create visuals that meet their specific needs.

Persona
We create a persona for the software based on the type of user.
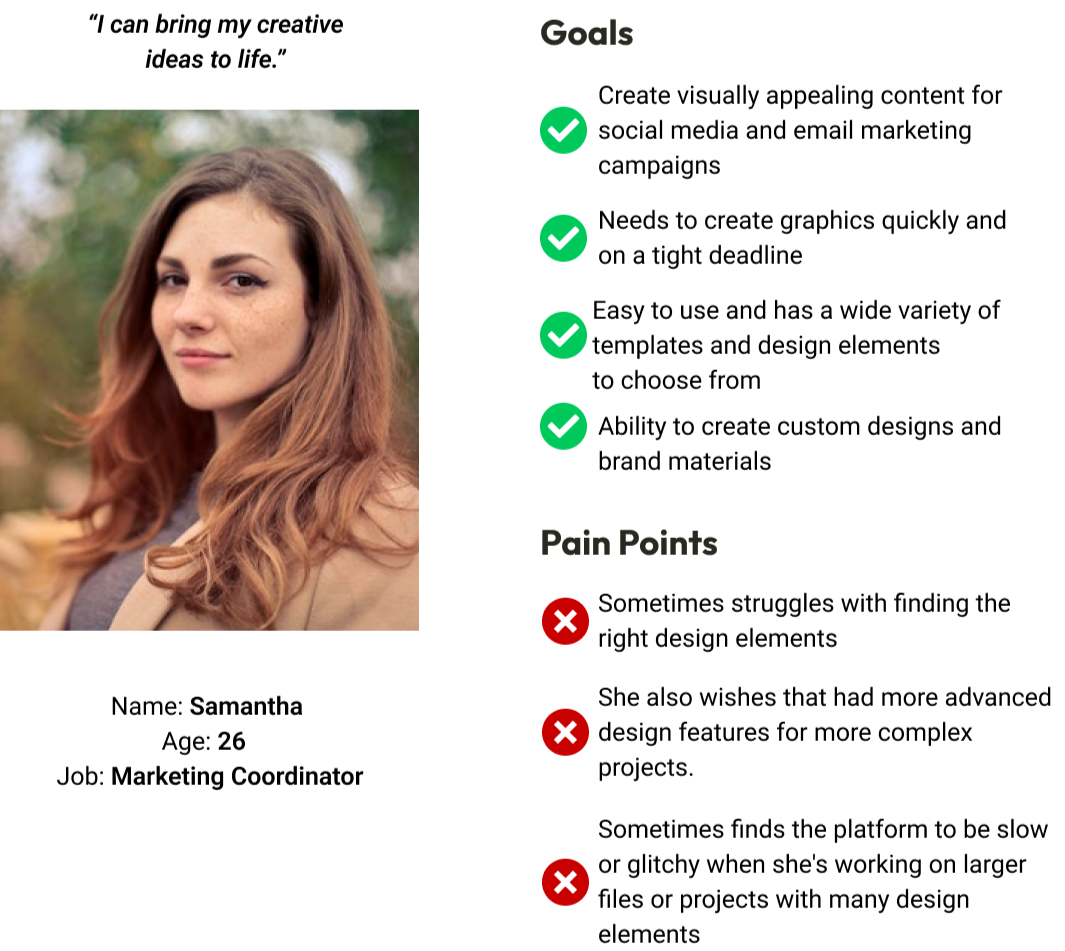
About Samantha
Samantha is a 26-year-old marketing coordinator who works for a small e-commerce company.
She enjoys photography and creating content for social media.
She is also an avid traveler and loves exploring new cultures.Samantha's job requires her to create visually appealing content for social media and email marketing campaigns. She often needs to create graphics quickly and
on a tight deadline.Overall, Samantha is a creative and hard-working marketer who relies on the Design tool to help her create visually engaging content for her company's online channels.
Time To Start Designing!
Once I went through all my investigation data,
it was time to portray out the primary flows and the starting low-fidelity wireframes.

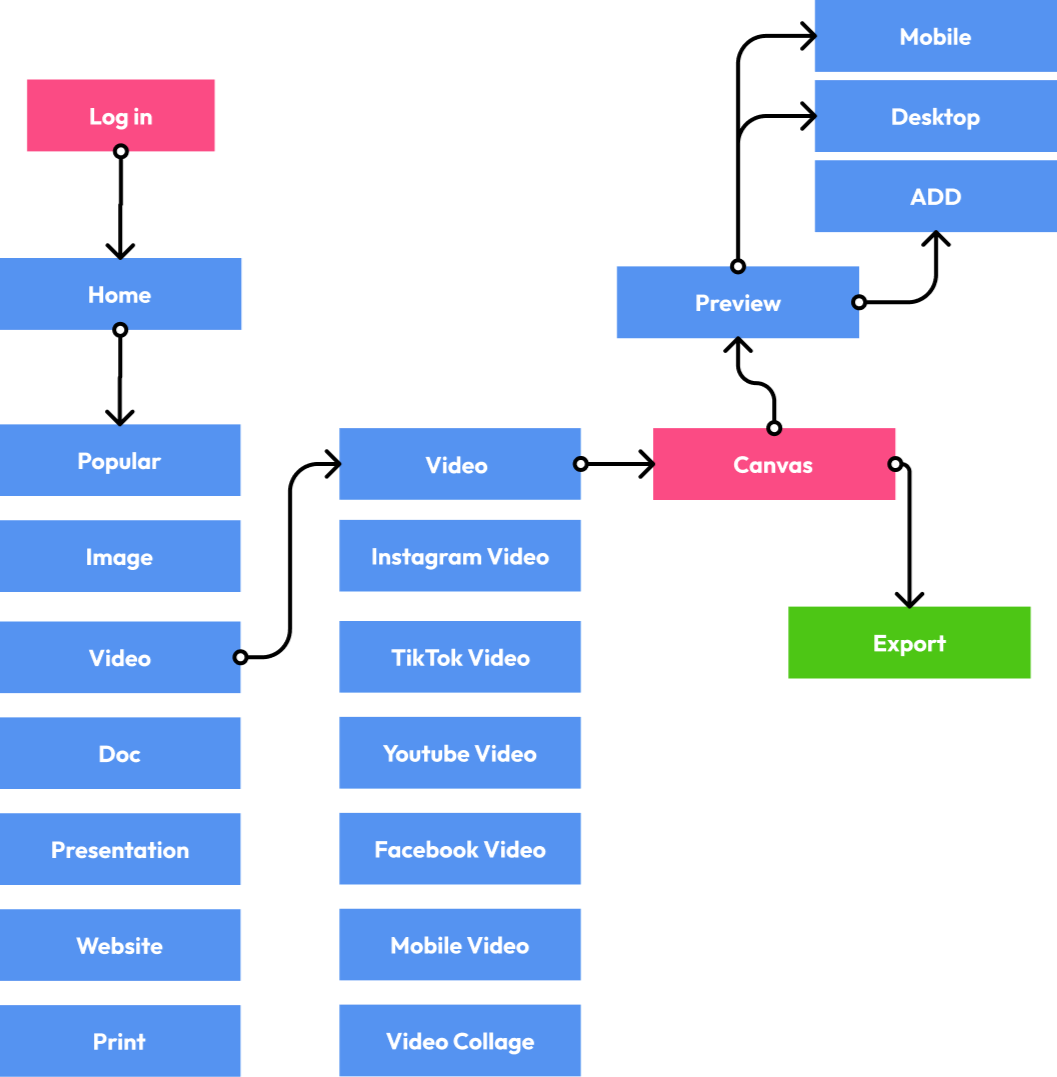
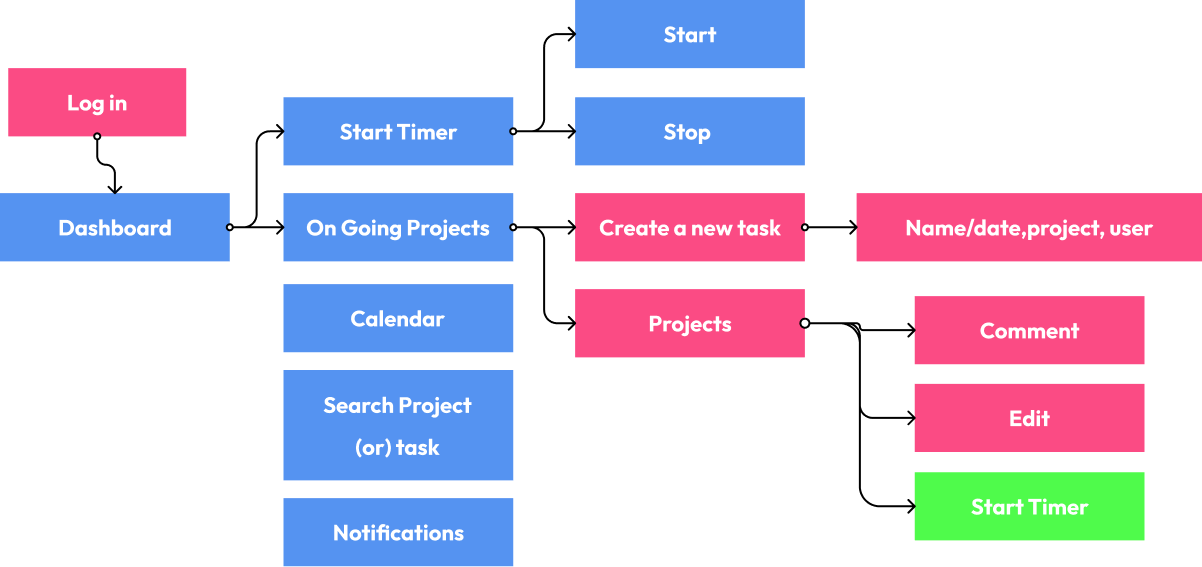
Flow Diagram
To outline all the necessary functionality, I created a simple flow diagram of the main task the user can do.
One of the flows is shown below.
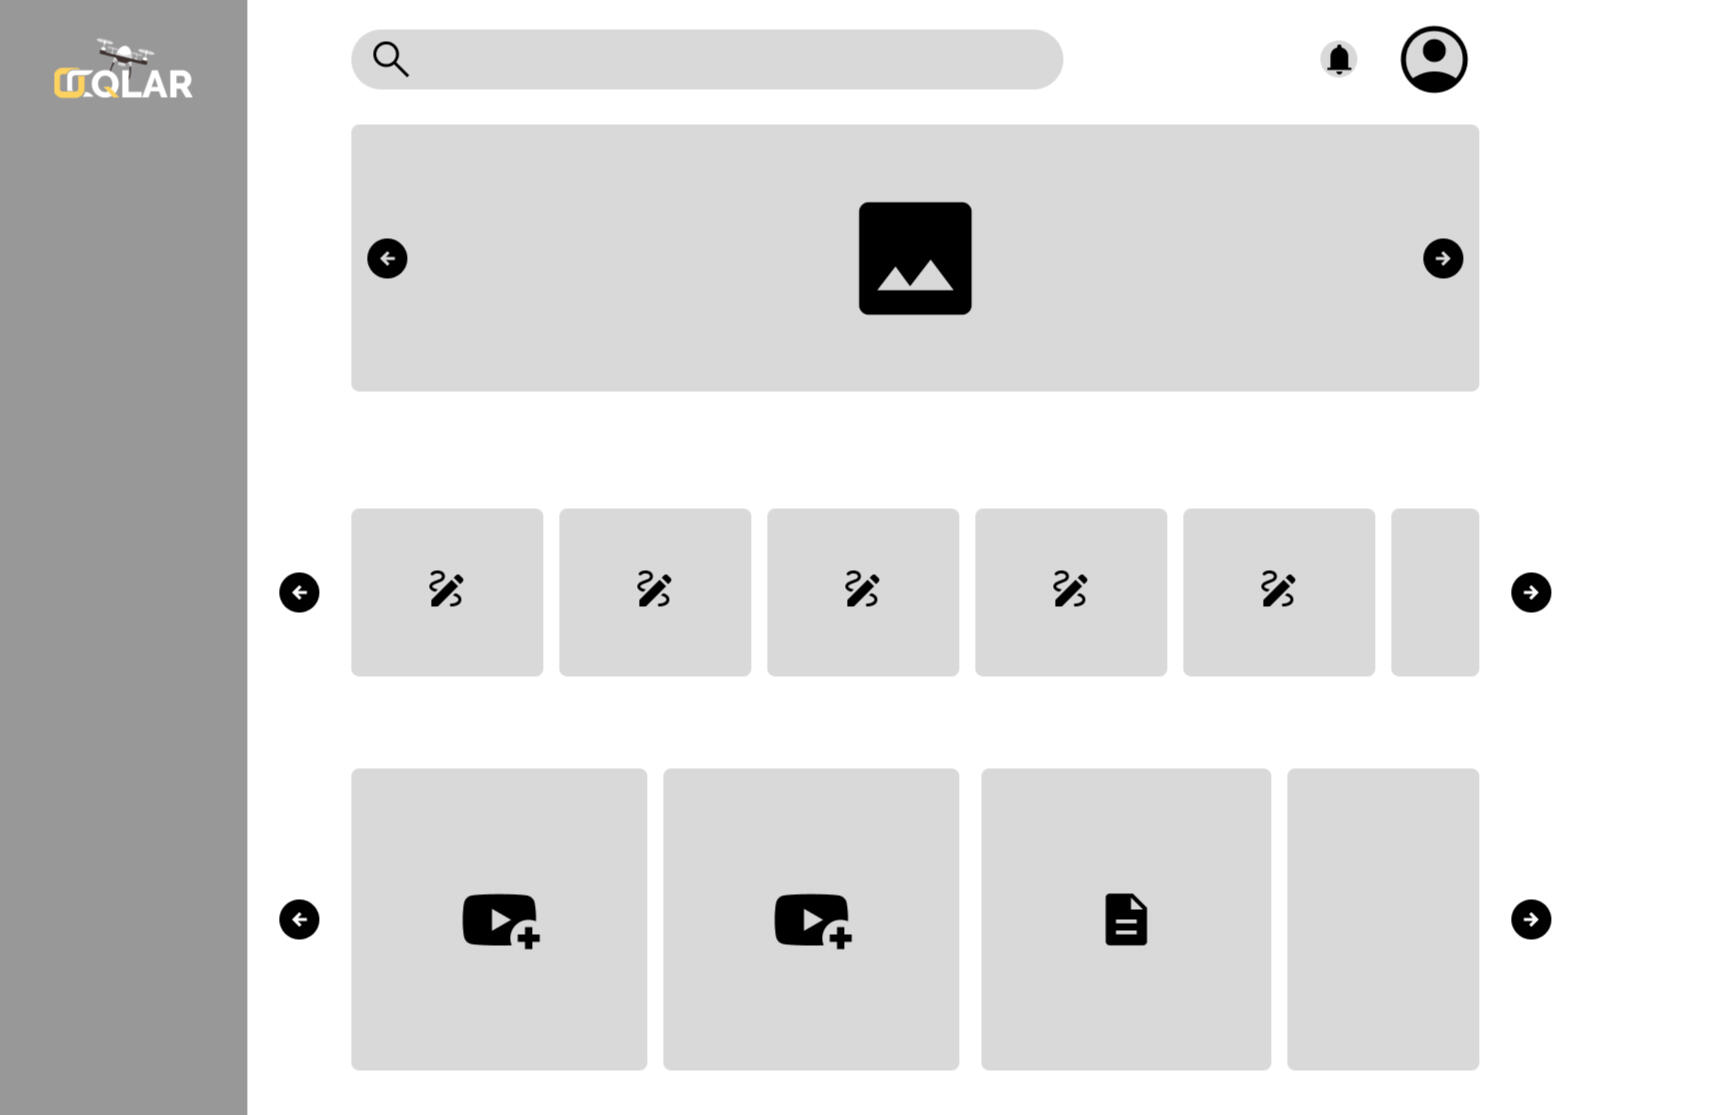
Low-Fidelity Wireframes
After completing the flow diagram,
I began creating low-fidelity wireframes for the majority of the main flows.
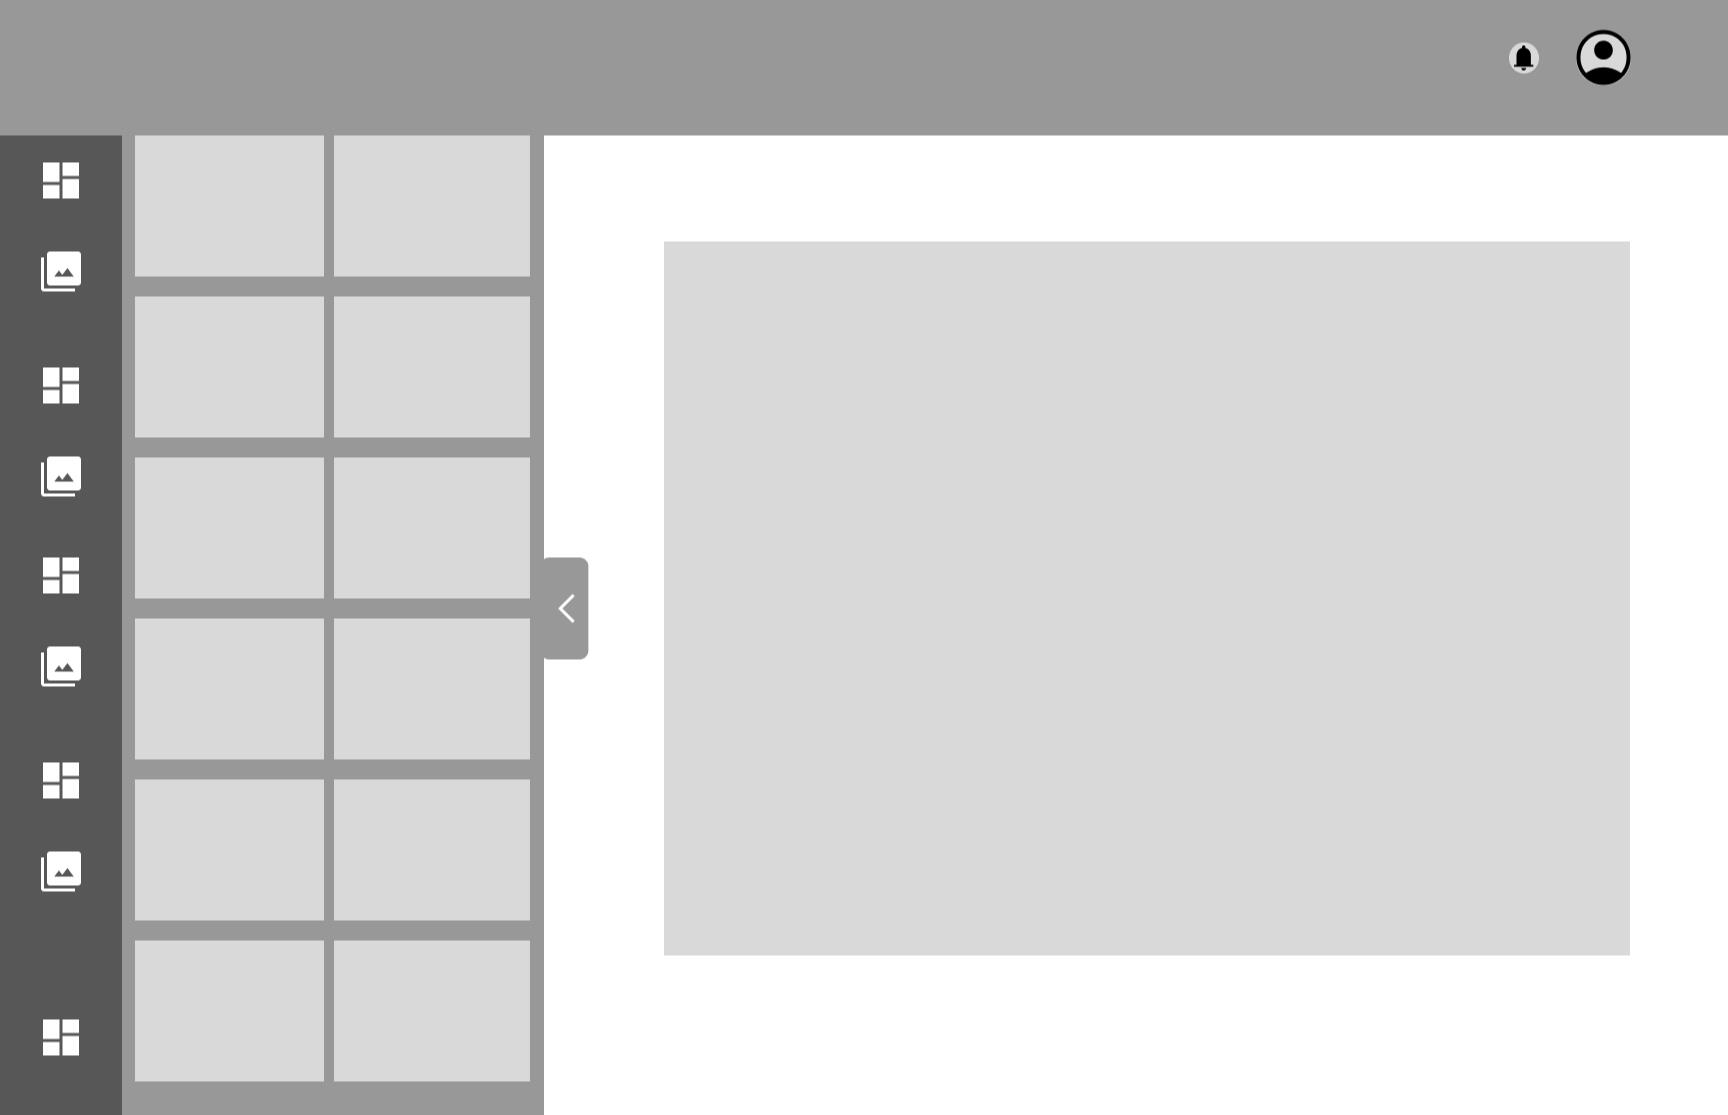
High-fidelity Prototype
My high-fidelity design was connected into a clickable prototype,
which will permit me to test the program and the modern tools' implementation and discover any unused needs
from the client.
Prototype Validation
I tested my model with ten users. Each was given the same task.I needed to be certain that each segment worked properly.
This was tried in an individual setting, where I presented the user to the software and asked them questions.
The questions were designed to determine whether the software's capabilities were sufficient to obtain it.
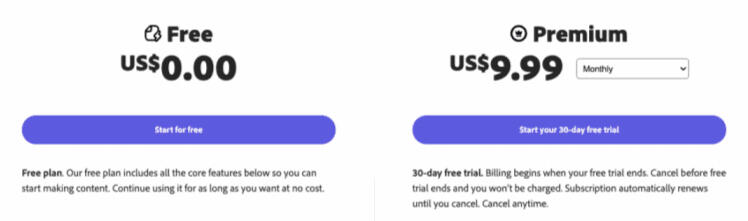
Price Point
The platform will offer a variety of design tools, templates, and resources to create visually appealing content for both personal and professional use.OCQLAR will offer several price points, including a free version as well as a paid subscription.
(10.00 USD per Month)The premium version will offer more options that will improve the user experience without affecting those who prefer the free version.

Project Summary
I've been on a wild ride with this project, starting from a simple idea and taking it to new heights with a range
of cutting-edge methodologies.From evaluating the market to conducting user surveys and usability studies, I've been knee-deep in research
and development.Along the way, I crafted a set of low-fidelity wireframes that evolved into a sleek prototype and high-fidelity UI designs. It's been an exhilarating journey, and I've learned a lot about the ever-expanding market for graphic design and the evolving needs of users.


Track your time,
Master your day.
Where
Mexico
Role
Product Designer:
UI & Researcher
What
Software
Category
Time Tracker
Why
UX/UI Challenge
When
March 2022 (1 week)
About
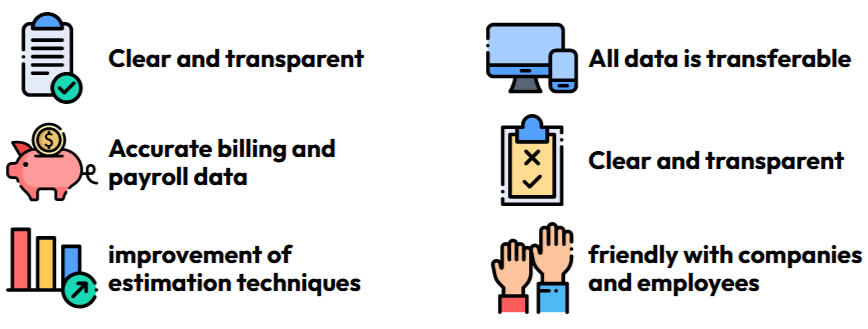
Time tracking allows you to keep track of the hours spent on individual tasks and on the project as a whole.This visibility helps you assess the accuracy of work estimates and the effectiveness of your employees.
Market Research
The Problem
When you are working on many projects and tasks, it's hard to keep control of the time and make it productive.
Using a time tracking tool can help.
However, this can cause some problems:

Competitive Analysis
I analyzed the most popular time tracking softwares withe their the pro’s and con’s
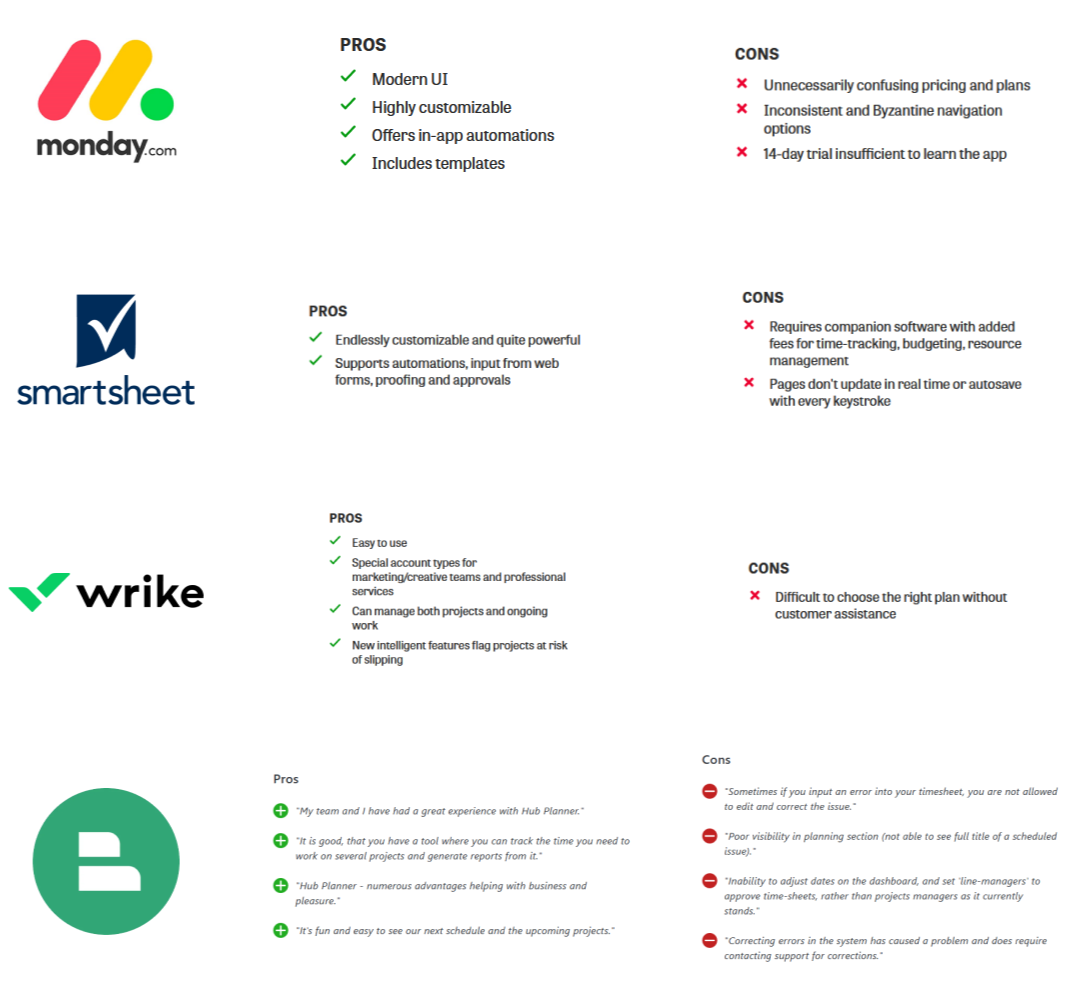
Web Research


Proposal
Make software simple to use who can be friendly to the company and the employee.so they are willing to use it and have better control of the time.
Features
Initial research shows:
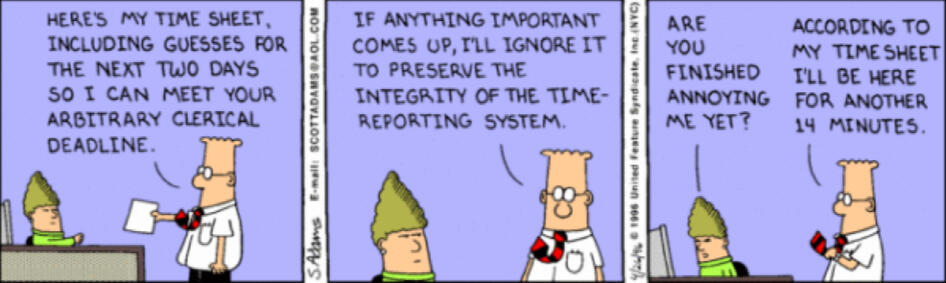
For a lot of workers, time tracking has all kinds of negative connotations.
The thing is, time tracking doesn’t have to have all these negative associations. In fact, if implemented right,
time tracking is good for everyone in an agency – including employees.Time tracking can be a great way to share information and make your agency a better place to work.
But always remember to include employees every step of the way and give them the tools they need in order to make it convenient for them to use the tool.
Persona
I create a persona for the software based on the type of user.

Jonathan (Creative Director) 36 years oldHe requires an automated tool that is simple to use.
who can help him track and manage their team's project deadlines
About jonathan
Jonathan is a 37-year-old creative director who is focused on managing his team's project deadlines. He is looking for a time-tracking software to help him stay organized and ensure that all of his projects are completed on time.He is likely someone who values efficiency and organization in his work and is dedicated to ensuring that his team is able to meet their goals and deadlines.

Ana (Graphic Designer) 26 years oldShe requires an automated tool that is simple to use.
who can help her manage her work
About Ana
Ana is a 26-year-old graphic designer who is looking for a tool to help her establish an efficient and organized workflow, manage her time, and prioritize important tasks.She is likely someone who is detail-oriented and values productivity in her work.She is looking for a tool that will help her streamline her workflow and ensure that she can stay on top of her tasks and projects.
Time To Start Designing!
Once I went through all my research data,it was time to sketch out the first flows and the initial
low-fidelity wireframes.
Flow Diagram
To outline all the necessary functionality, I created a simple flow diagram of the main task the user can do.
One of the flows is shown below.
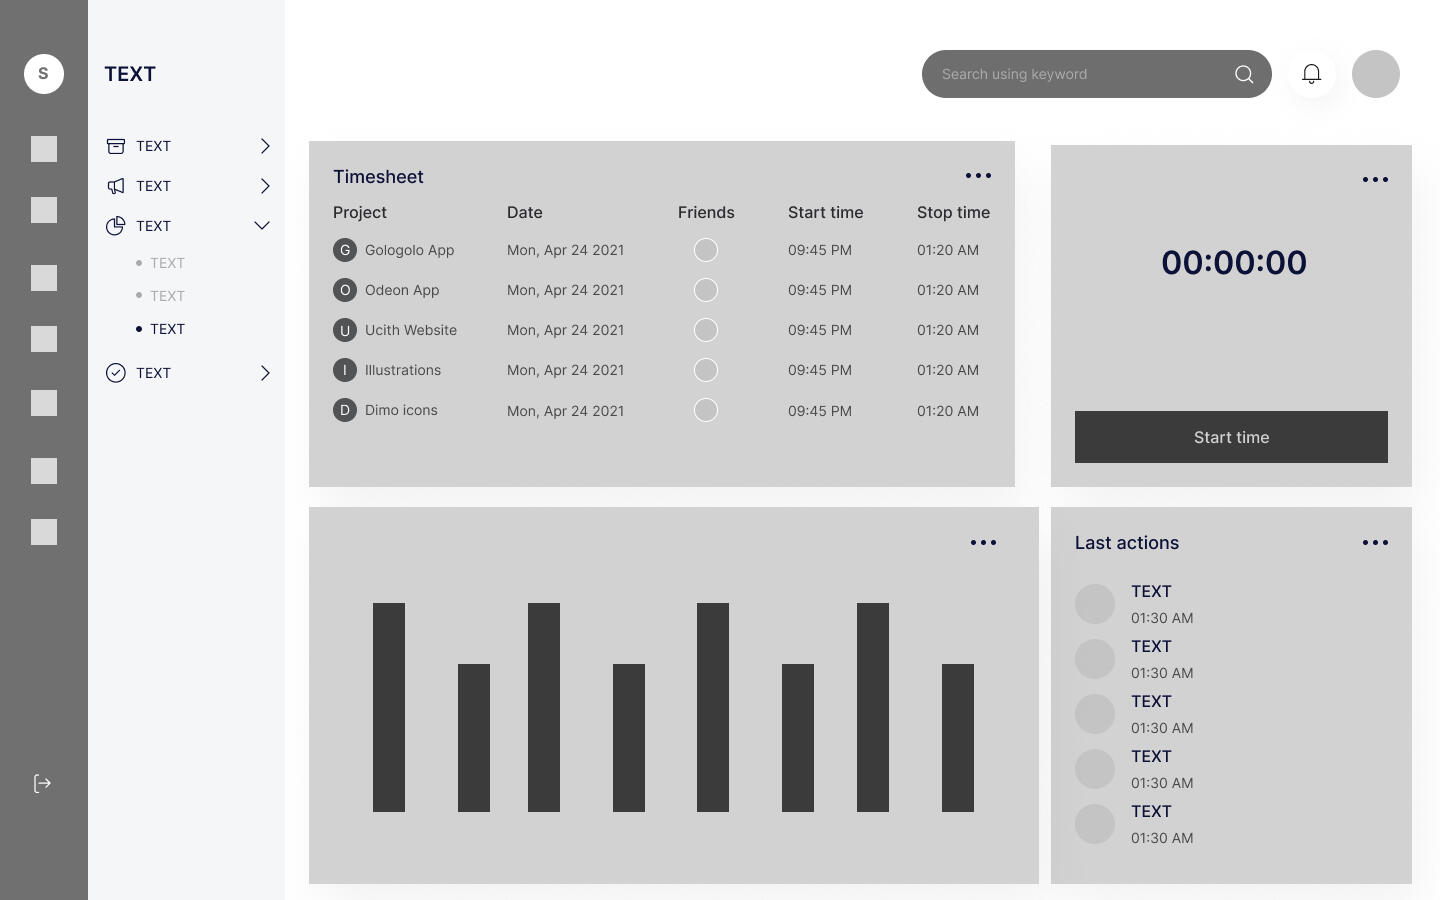
Low-Fidelity Wireframes
Once the flow diagram was established, I started creating the low-fidelity wireframe of the main flows.
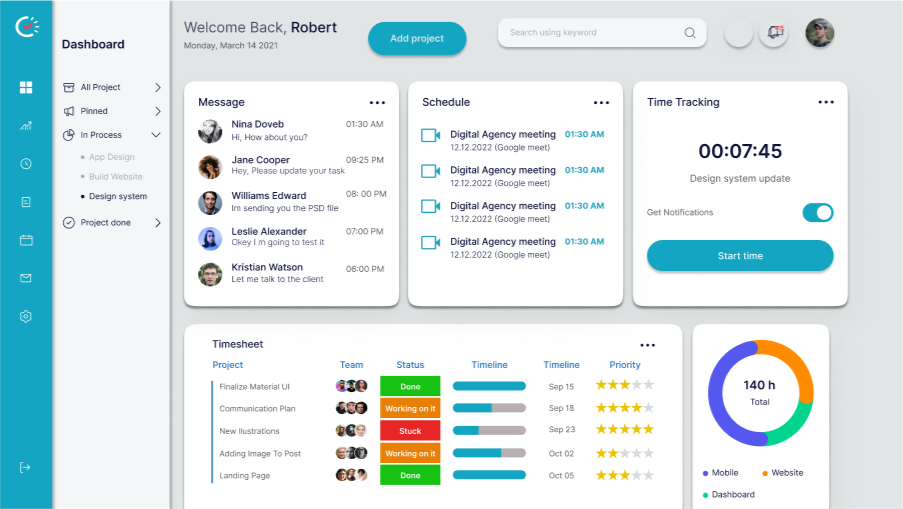
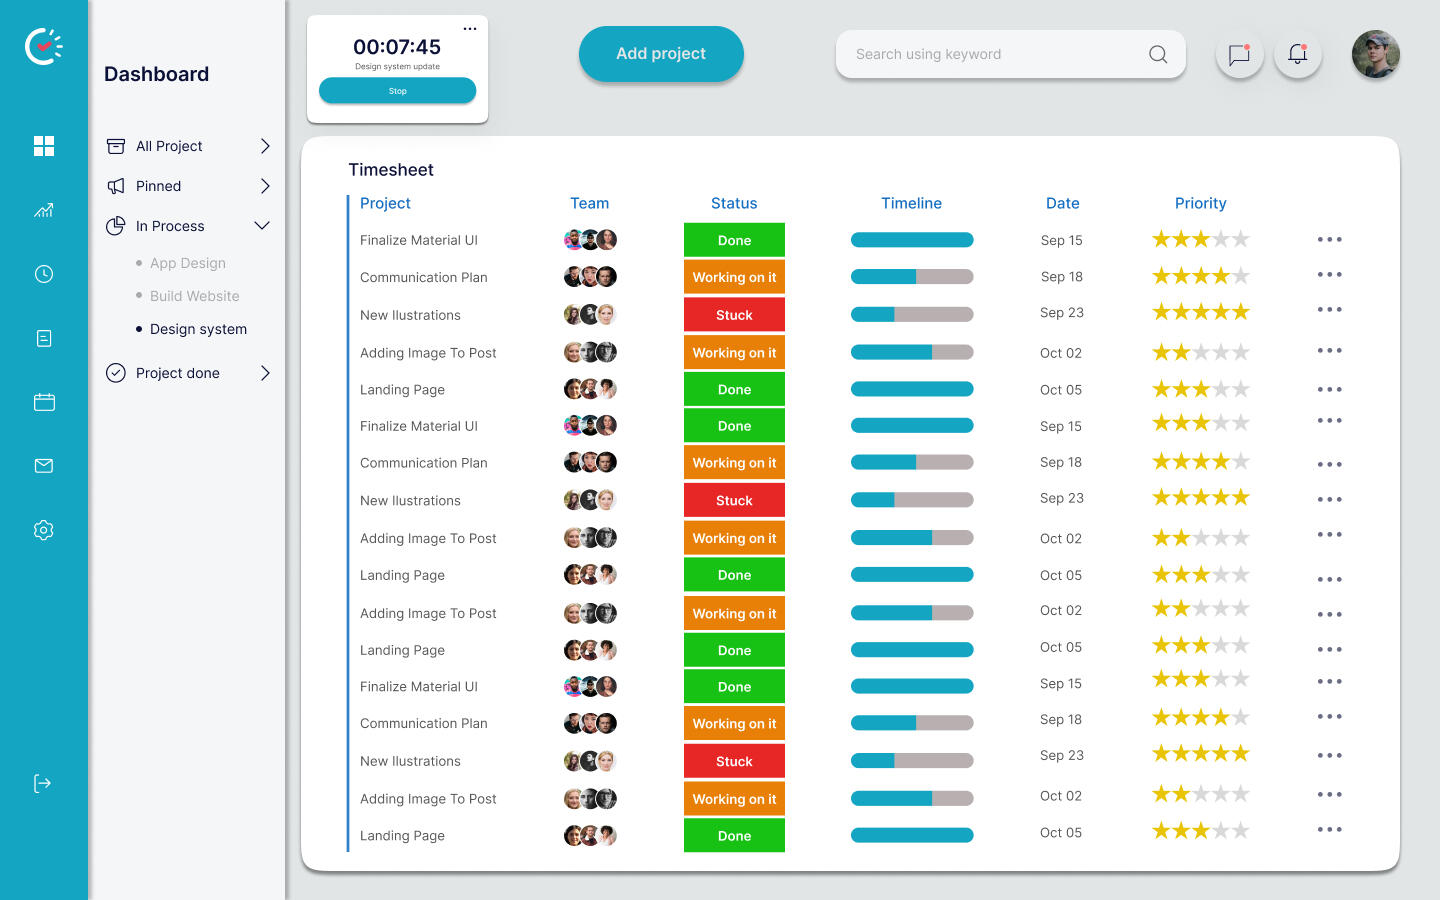
High-fidelity Prototype
My high-fidelity designs were linked into a Clickabe prototype, which will allow me to test the app with
a small group of users.
Prototype Validation
I approved my model with ten coworkers.Each was given the same errand. I needed to be certain that each segment worked properly.
This was tested in a one-on-one setting, where I introduced the user to the software and asked questions.The questions were designed to determine whether the software capabilities were simple to understand and valuable.
Project Summary
During the venture, I was overseen to assess the showcase, do a speedy client overview, perform an ease of use analysis, make a set of low-fidelity wireframes,
interface them into a model and construct them into high-fidelity UI designs.I, too, performed broad quality assurance in the final checkup circular.
focusing on unused instruments that will offer assistance and make strides in client involvement.
Once I went through all my research data, it was time to sketch out the first flows and the initial low-fidelity wireframes.

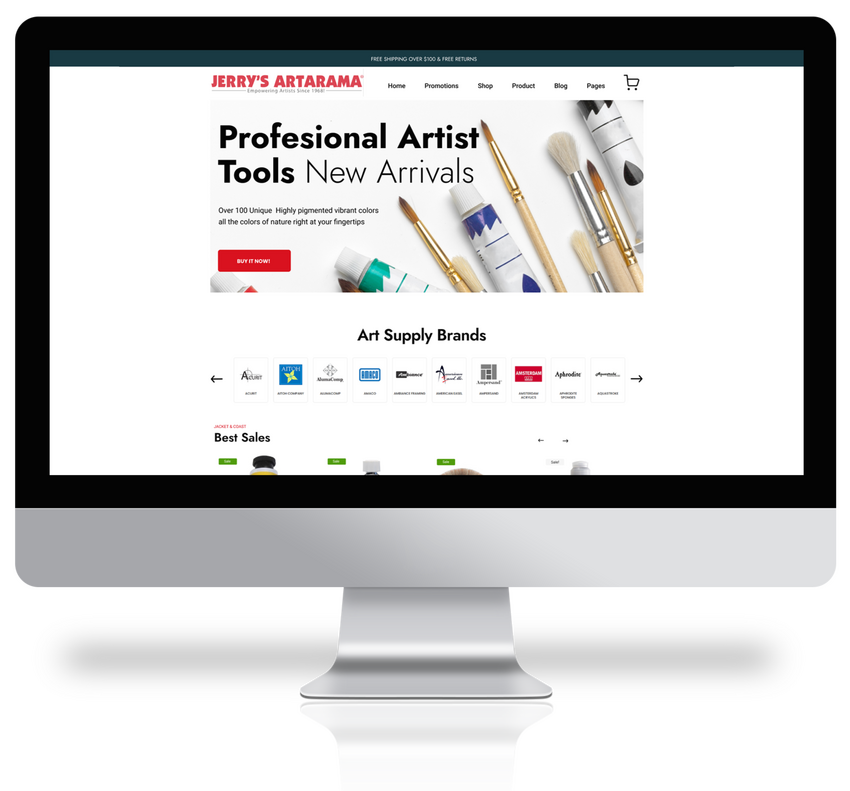
The Professionals Source
For Art Supplies & Framing
Where
Mexico
Role
Product Designer:
UI & Researcher
What
Website
Category
E-Commerce
Why
Freelance
When
May 2022 - (2 week)
The context
Jerry's is celebrating his 54th anniversary They want to increase the number of customers and improve their experience through the website.

Market Research
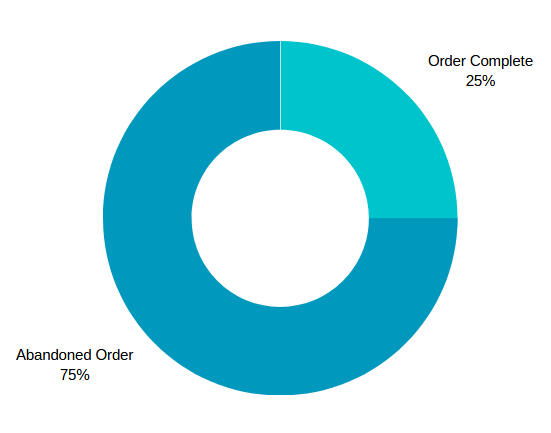
Jerry’s Artarama UX Design team recently found that
75% of their online shoppers abandoned an order in the past quarter.
Some users have sent emails to customer support expressing that the checkout process is "too long and complicated."
Competitive analysis
I analyzed the current website in order to identify and understand usability problems, looking for reviews from current clients and also making a bench marking report.•investigated on blogs, Reddit, and other similar sites.

Lacked understanding in customer wants, needs and expectations.
•Current frustrations and pain points?
•What did they really want?
•What did they really need?
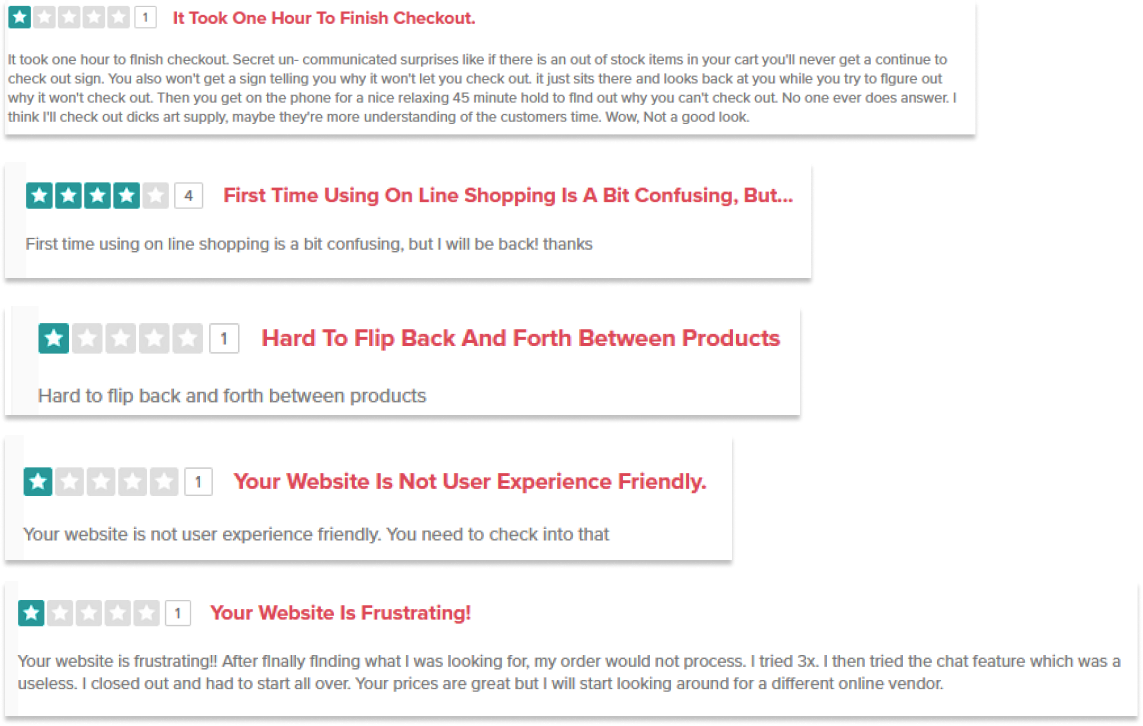
User Reviews
Reading the client reviews, we can see that they are struggling when they try to buy a product on the website.
BLICK has:
•A user interface that is simple to understand and navigate
•A three-step checkout


CHEAP JOE'S has:
•Has a list of products in stock, and you can buy multiple items at the same time.
•A two-step checkout
With my research, I had some insights:
•A more user-friendly interface:
Users reported that the website is cluttered with information and causes confusion.•Product Stock:
Adding buttons will make the user have better control over the amount of product they want to buy.•Short Process:
Instead of 5 steps, it can be shortened to 2 to make it faster for the user.

Initial research shows:
There is a growing need for a new
user flow and a new UI, with a checkout with fewer steps so the user can choose the product they need and buy it fast.
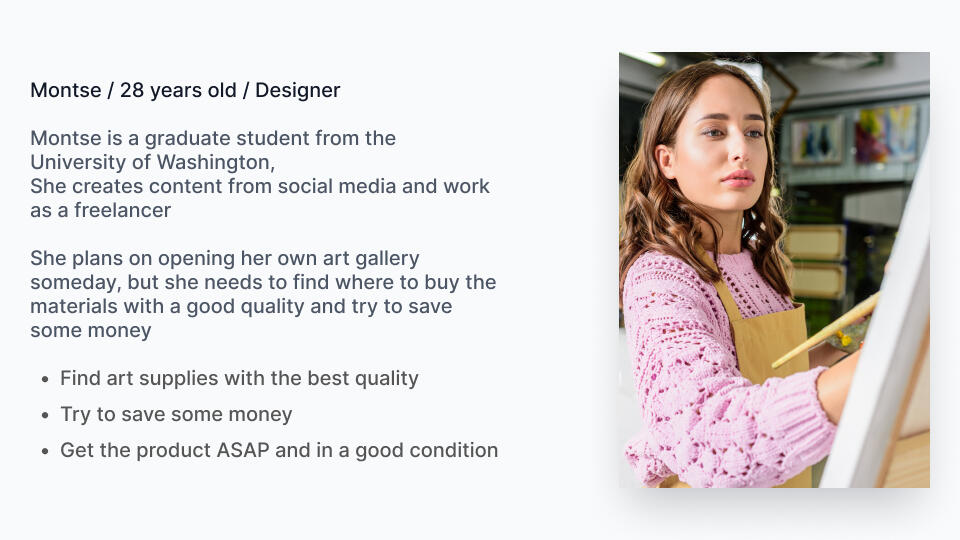
Persona
I create a persona for the website based on the type of user.

It's finally time to start designing!
Once I went through all my research data, it was time to sketch out the first flows and the initial
low-fidelity wireframes.
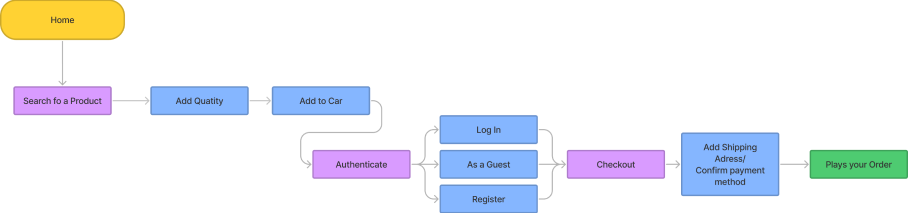
Flow Diagram
To outline all the necessary functionality, I created a simple flow diagram of the main task the user can do.One of the flows is shown below.
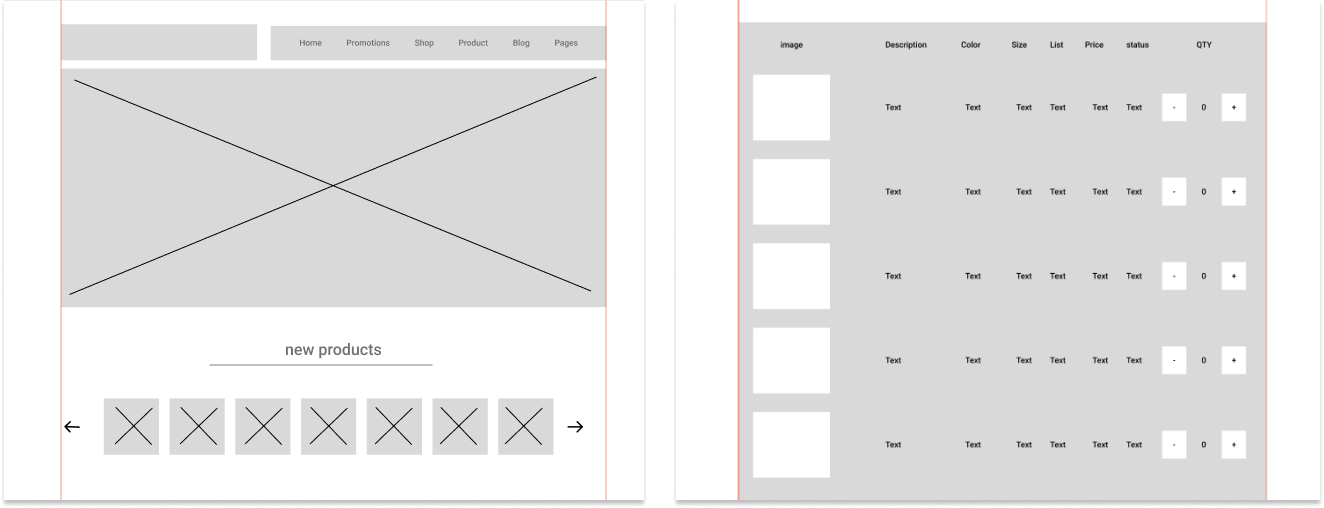
Low-Fidelity Wireframes
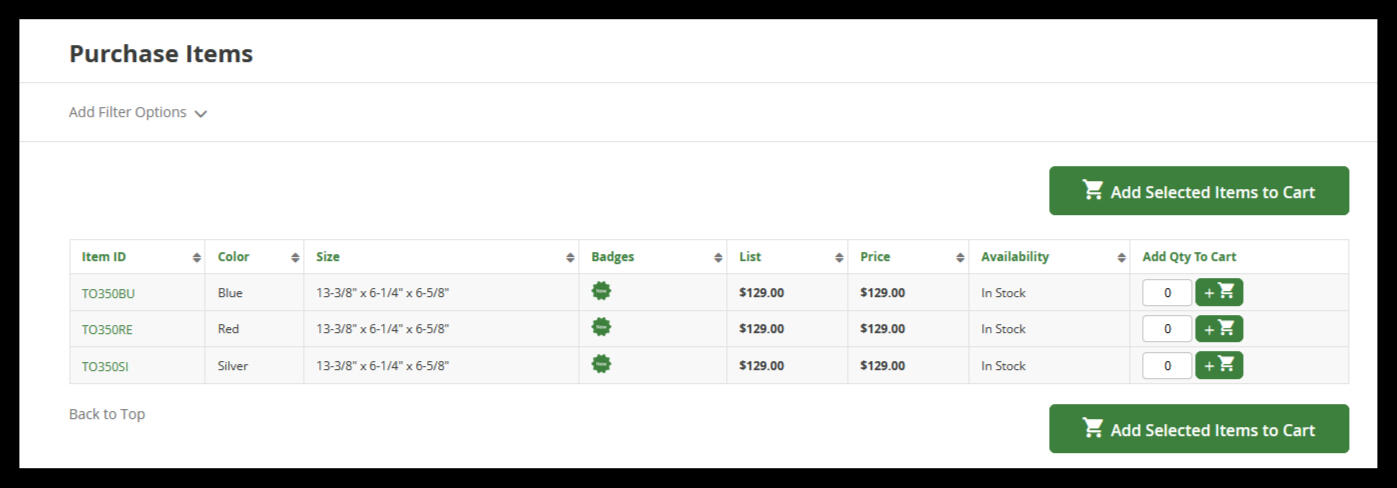
Once the flow diagram was established, I started creating the low-fidelity wireframe of the main flows.
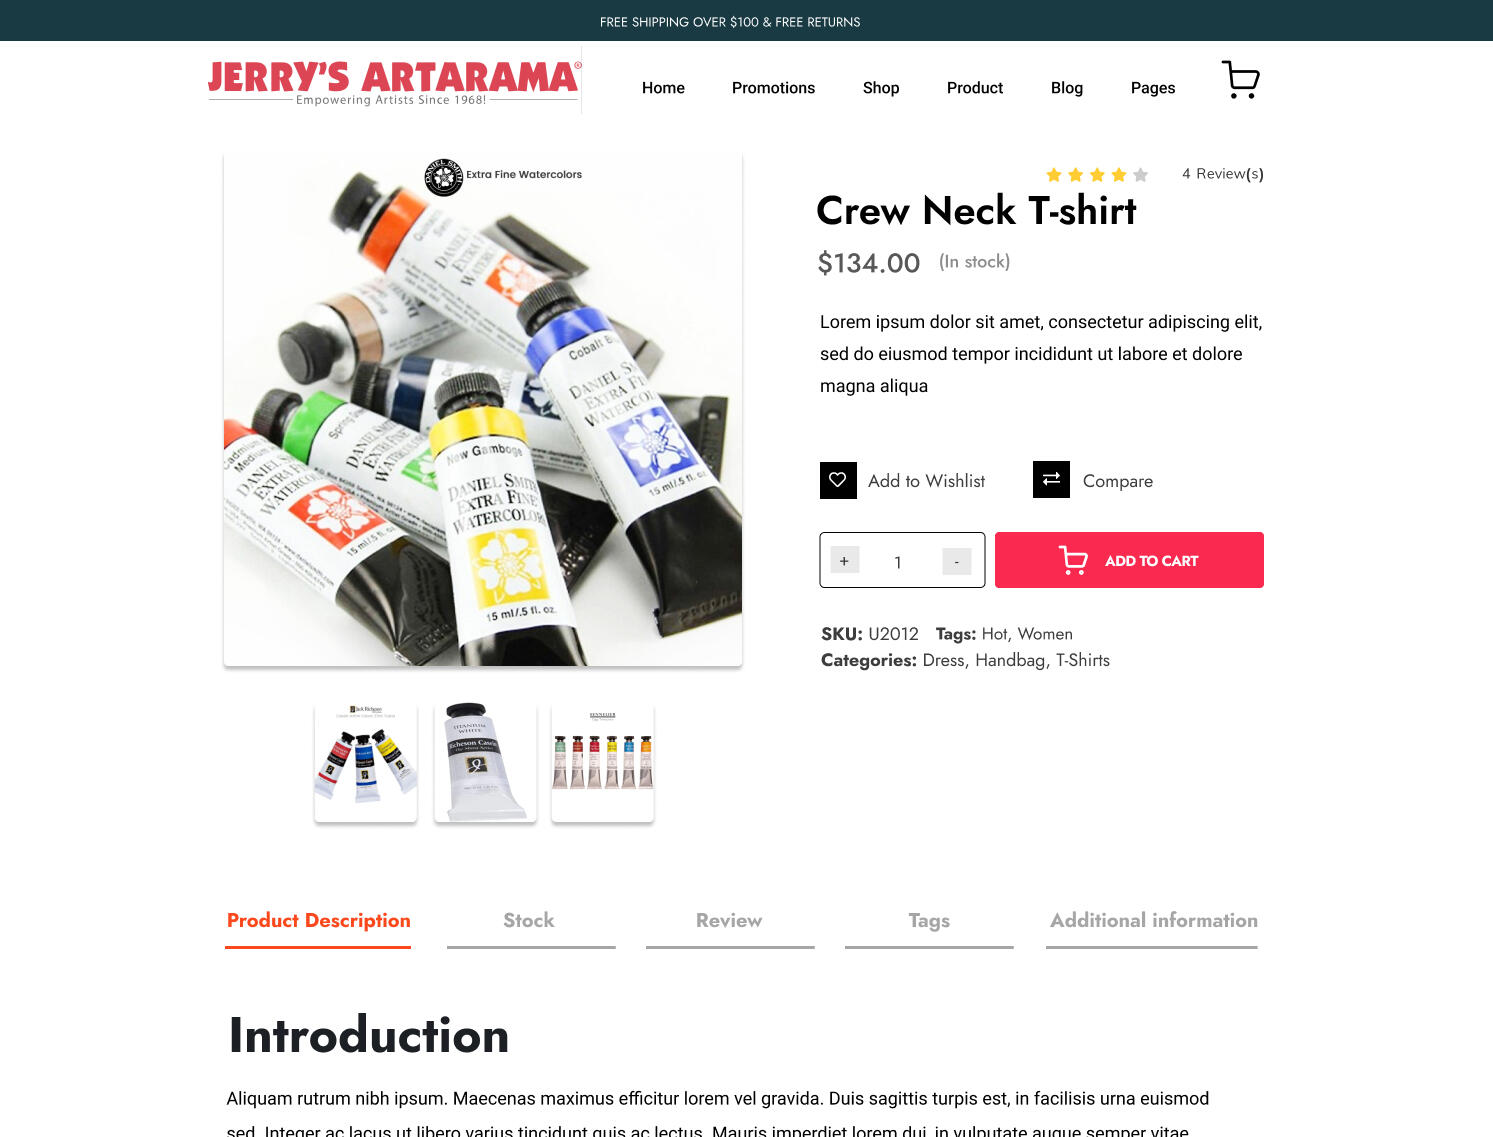
High-fidelity Prototype
My high-fidelity designs were linked into a clickable prototype, which will allow me to test the website
with a small group of users.
Prototype Validation
I validated my prototype with eight users.
Each was given two different tasks.
I wanted to ensure that users could make a purchase.
This was tested in a Zoom meeting,
where I introduced the user to the website prototype and asked them questions.
The questions were dedicated to finding out whether the functions of the website were easy enough to understand.

Project Summary
During this project, I was able to learn more about the importance of a good user flow from many different types of clients in an e-commerce. Use wireframes with low and high fidelity for testing.
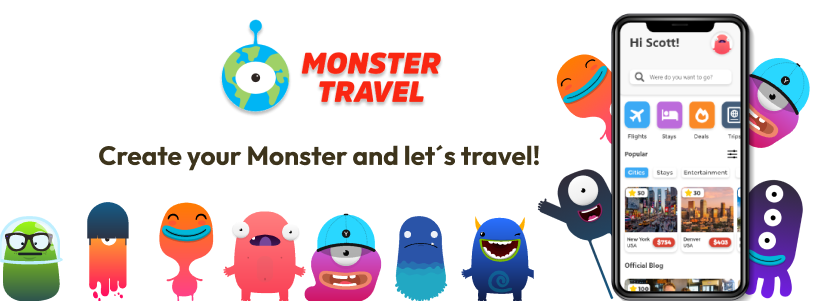
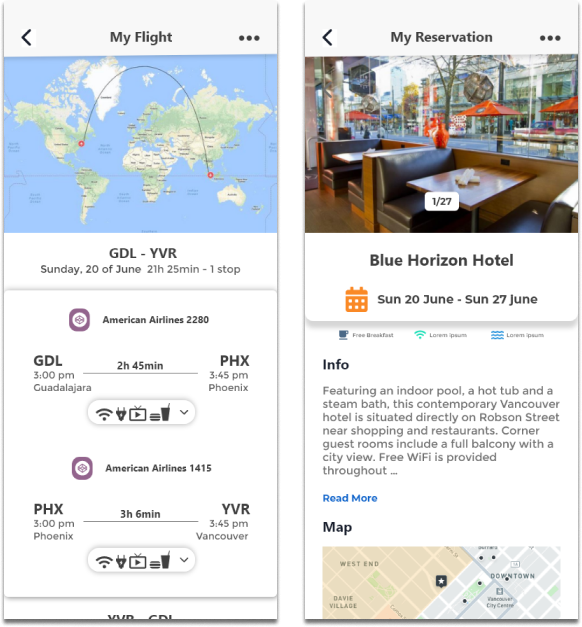
all-in-one travel app
Monster Travel
Where
Mexico
Role
Product Designer:
UI & Researcher
What
Native Mobile App (iOS)
Category
Booking App
Why
UX Career Final Project
When
April 2020 - February 2021
Why I made this Project
I enjoy traveling and learning about different cultures,so the research was very interesting for me.The purpose of this app is to allow travelers to compare the best prices for different travel agencies, plan their trip, and also contribute to the community by creating reviews of many places that would help everybody get the best experience on their vacation.

Market Research
The Claim
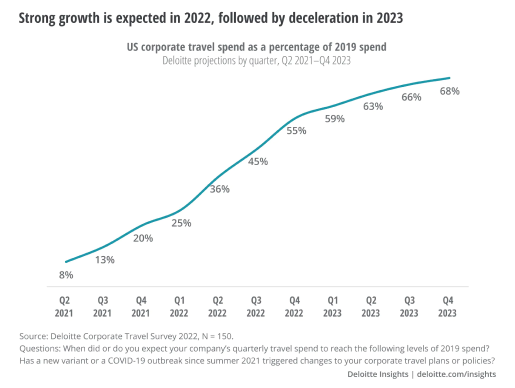
Economist Intelligence Unit (EIU) recently released its Tourism in 2023 report.
This report assesses the growth prospects, top risks and key trends facing the sector next year.
The report finds that global tourism arrivals will increase by 30% in 2023, following growth of 60% in 2022
The Problem
To destinations, mobile apps can be highly valuable for helping tourists find things to do and have better experiences during their visits.
However, many destinations are finding that the apps they invest a lot of time and money in often fall short of expectations.

Competitive Analysis
I analyzed the most popular apps in the space-looking both at the booking experience and the negative
app store comments to find patterns.

Problems from the comments
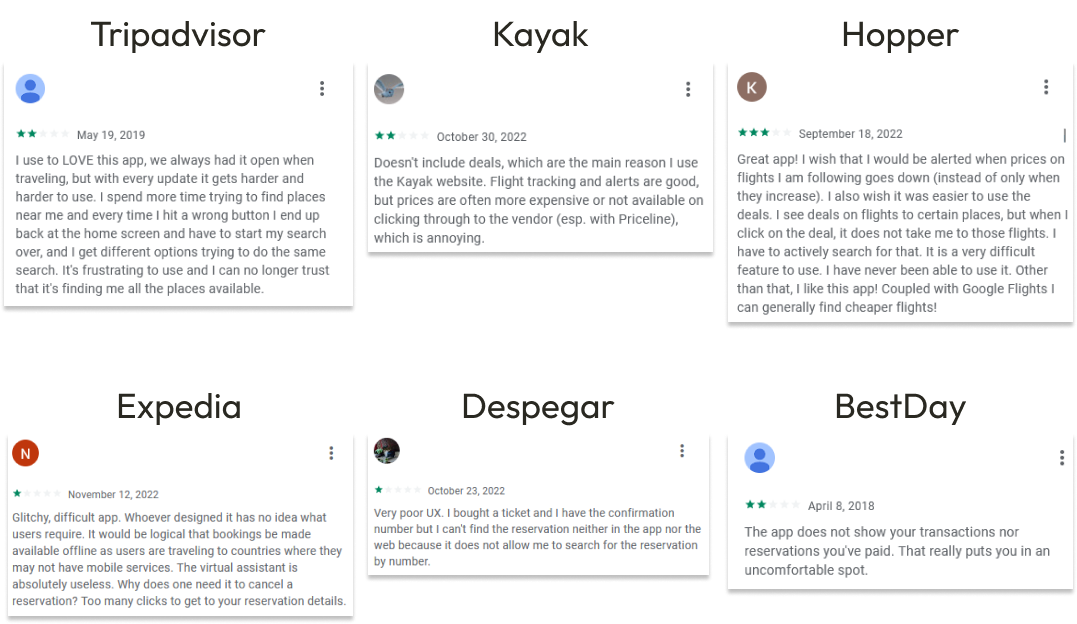
Tripadvisor has:
•Access to more than 830 million reviews of hotels, flights, activities and restaurants.•A travel planning tool.•Possibility to add your own reviews and photos of places you visited.
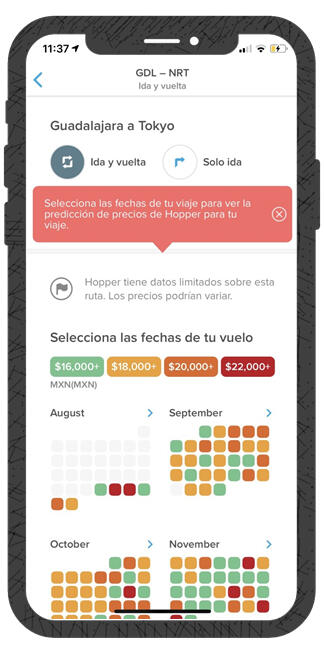
Hopper has:
•Cheapest flight finder using a
color-coded calendar.•Receive personalized notifications to your needs
User Survey
I conducted a quick interview with people who went on vacation recently.
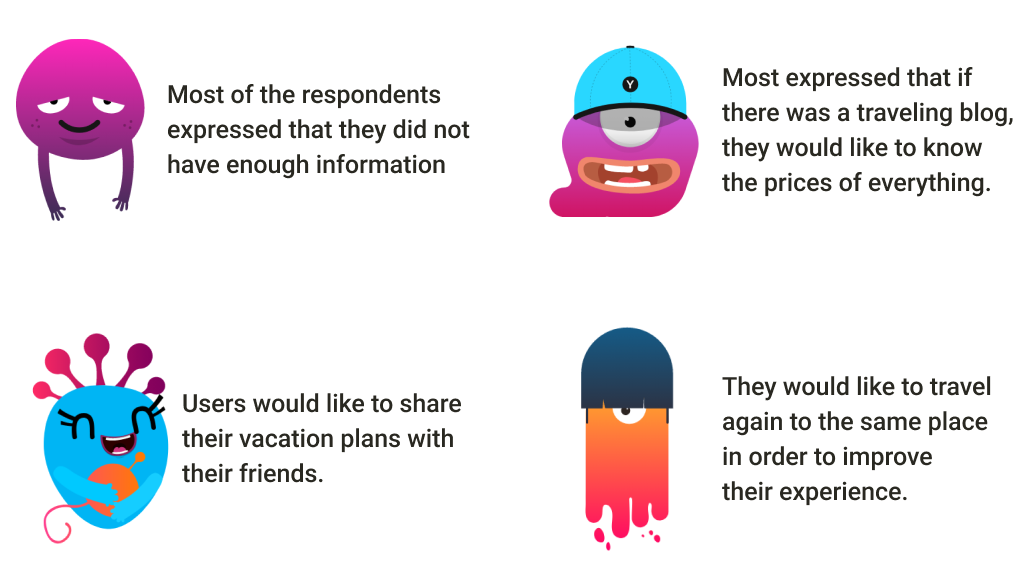

Initial research shows:
There is a growing need for a convenient,
easy-to-use booking app with a search engine that helps the users find the best prices with all the information they need
Persona
I create a persona for the app based on the type of user.

About Noah
Noah is a photographer who enjoys traveling to new destinations with his friends,always looking for the perfect shot.
He does not always have the best budget, so he needs to find the best pricing and all the information so he does not get caught in a tourist trap and lose his money and time.
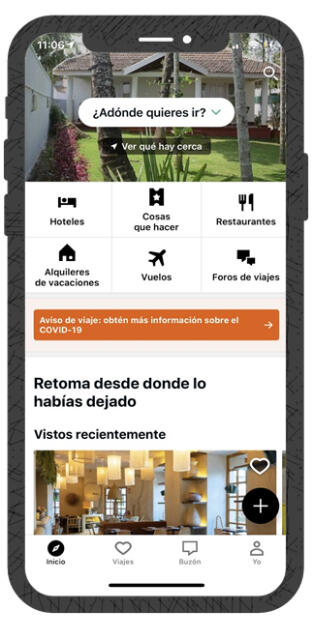
Time To Start Designing!
Once I went through all my research data,it was time to sketch out the first flows and the initial
low-fidelity wireframes.

Flow Diagram
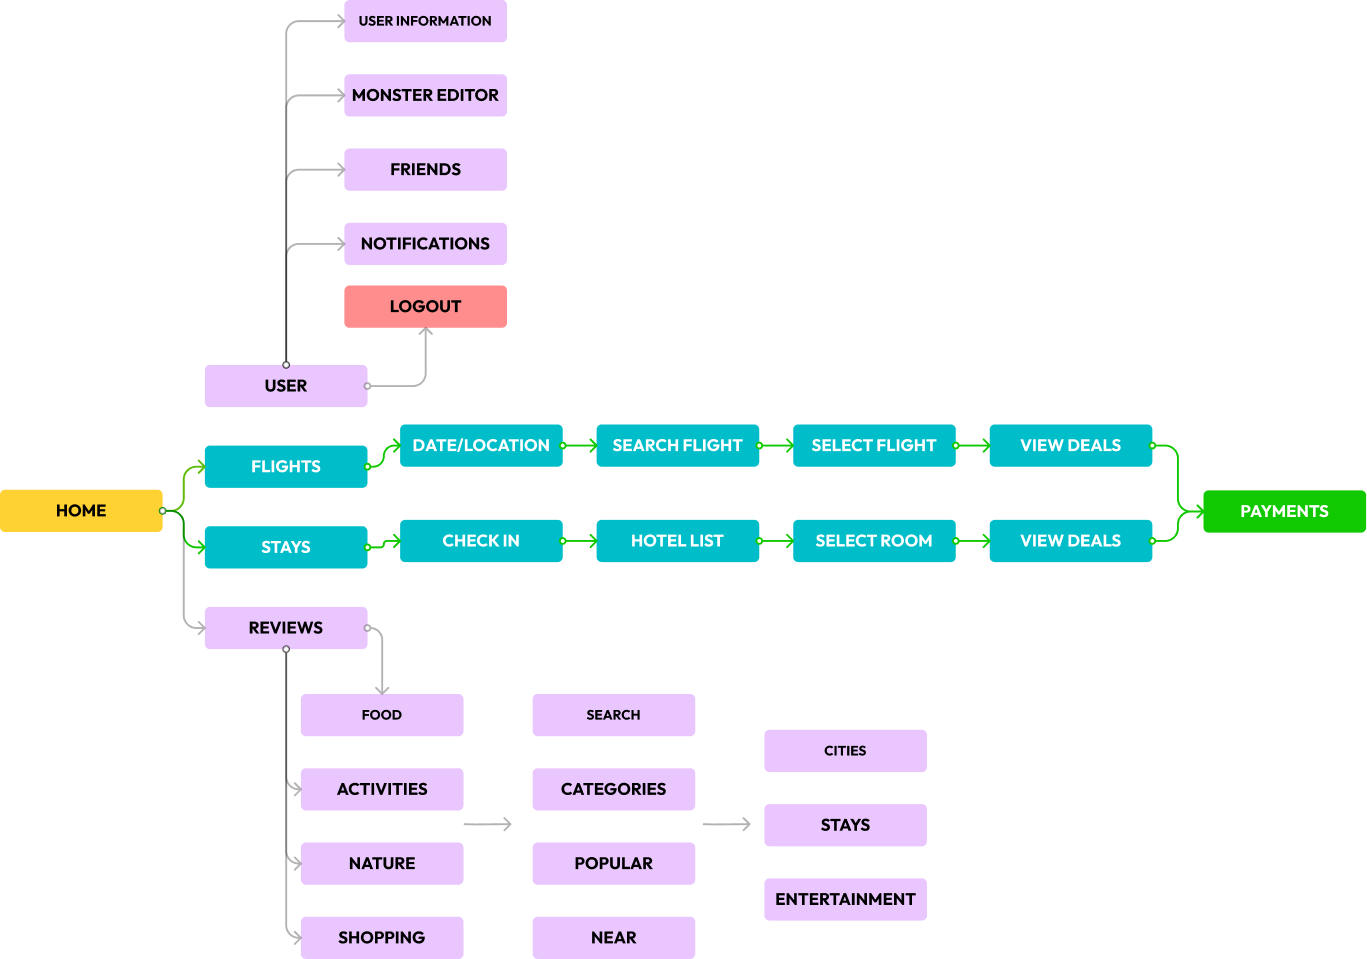
To outline all the necessary functionality, I created a simple flow diagram of the main task the user can do.
One of the flows is shown below.
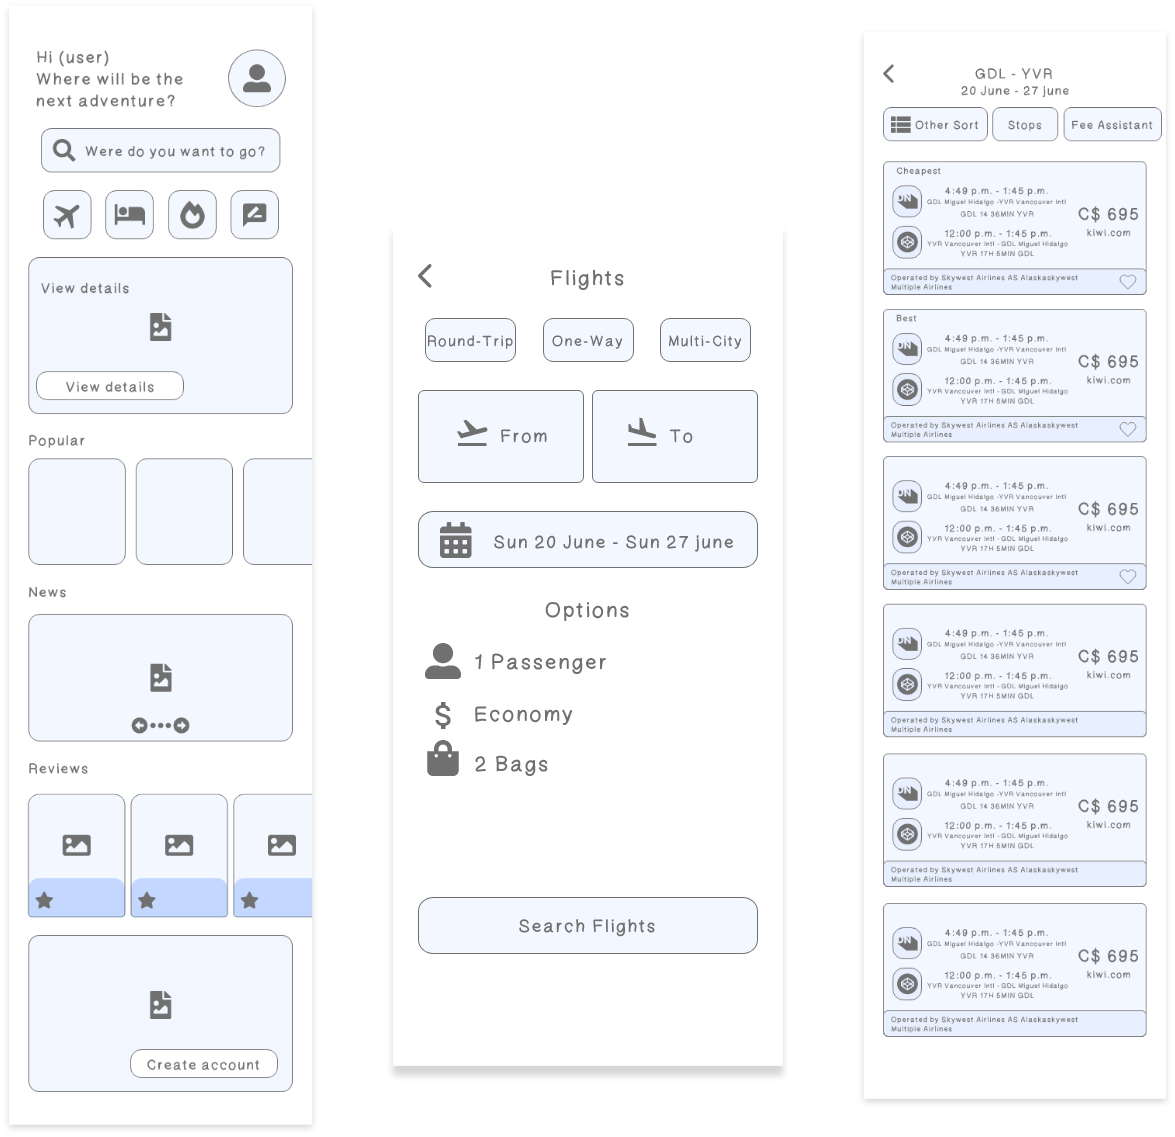
Low-Fidelity Wireframes
Once the flow diagram was established, I started creating the low-fidelity wireframe of the main flows.
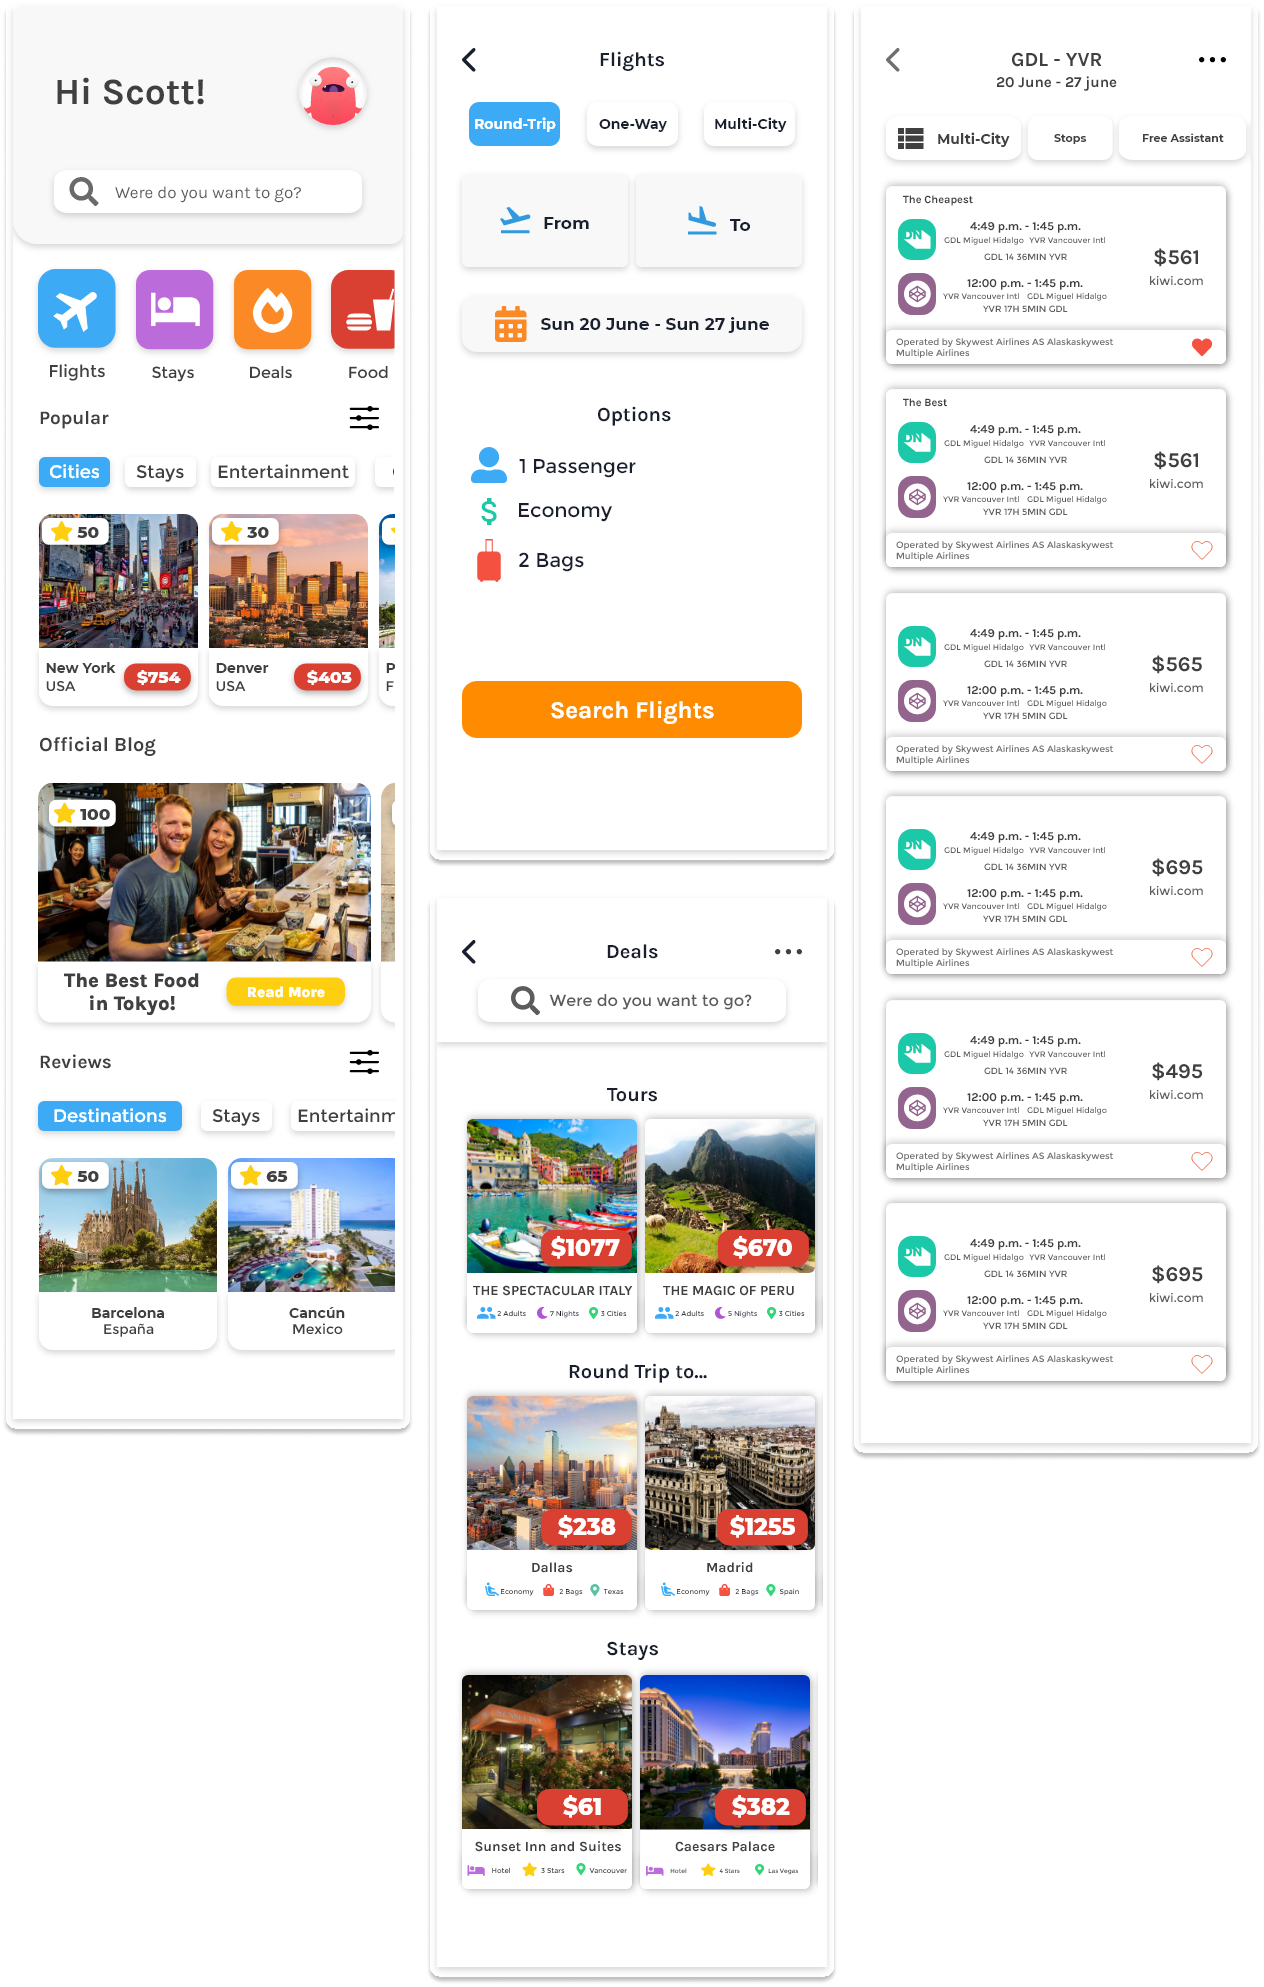
High-fidelity Prototype
My high-fidelity designs were linked into a Clickable prototype, which will allow me to test the app with a
small group of users.
Prototype Validation
I validated my prototype with ten users. Each was given a portion of the prototype dedicated to different categories.
I wanted to be sure users understood how every section worked.This was tested in person, where I introduced the user to the app and asked them questions.
The questions were dedicated to finding out whether the functions of the app were easy enough to understand.
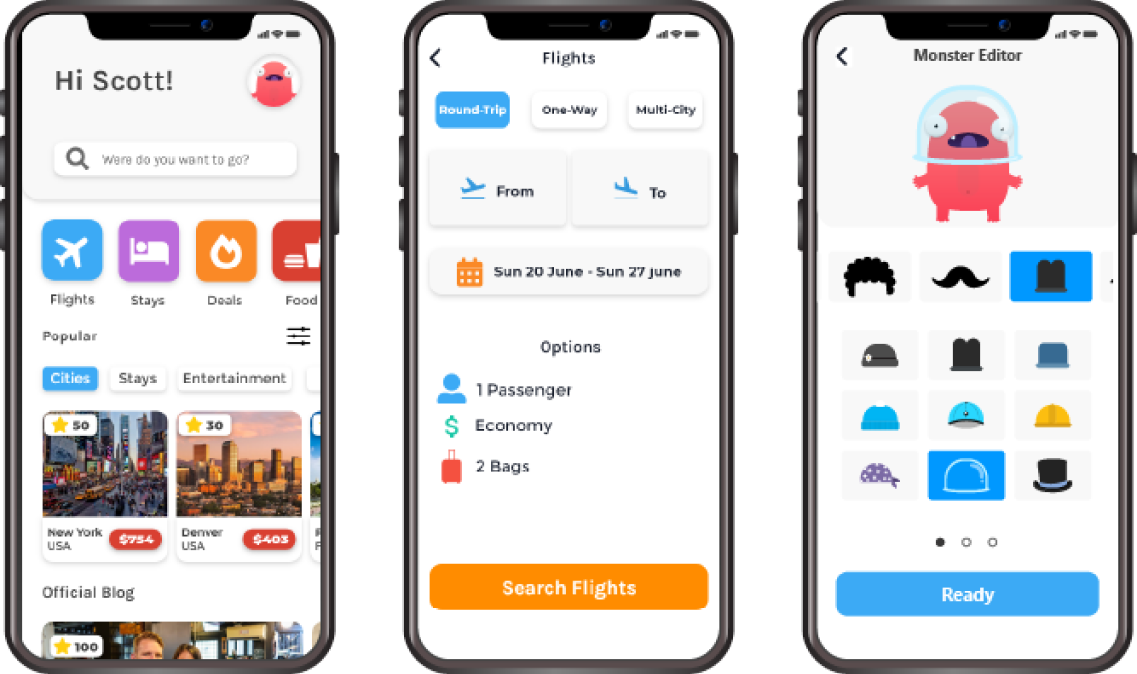
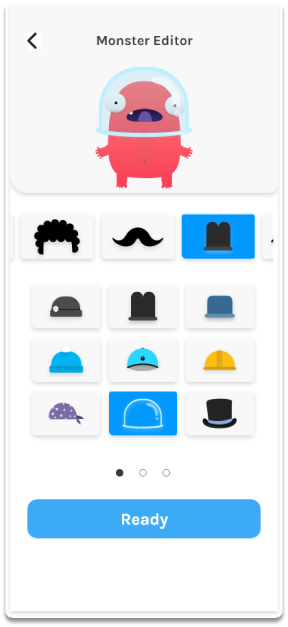
Monster Editor
As an added value, we asked the people
if they would like to have an avatar.
The users reacted positively to the idea of creating an avatar.By making a purchase or writing a review in the app, the user will be rewarded with accessories to continue customizing an avatar.
Prototype update concept
Working with the prototype and the users helped me find new pain points and new ideas that could be implemented in the application to help the user have a better travel experience,such as:
Offline Tools
The user will be able to check all their information without the need for an internet connection.

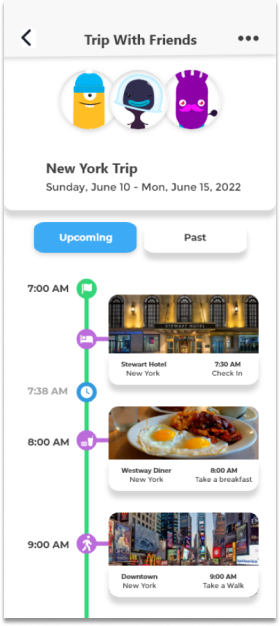
Travel Planner
Plan your trip and share it with your friends and family. Everyone can contribute to the trip plan.Add notifications, notes, and comments.

Project Summary
During the project, I managed to evaluate the market, do a quick user survey, perform a usability study, create a set of low-fidelity wireframes, connect them into a prototype, and build them out to high-fidelity UI designs.In the last checkup round, I also did extensive QA focusing on new tools that will help improve the user experience.
A Little Bit About Myself
Hi, I'm Felipe Herrera, a Data Analyst with a passion for movies, games, and animation.I grew up in Guadalajara, Mexico, where I spent my childhood playing Super Mario, Pokémon, and Final Fantasy.

I'm a Data Analyst and UX/UI Designer with a background in Motion Graphics and Video Editing.
I use data-driven insights to optimize user experiences and create intuitive designs.
Whether analyzing user behavior, designing interfaces, or crafting animations, I’m passionate about turning data into impactful experiences.
I love exploring new cultures and cuisines, and I'm always looking for inspiration in the world
around me.Traveling has taught me so much about myself and the world around me. It's opened my mind to new possibilities and made me a more well-rounded person. I'm so grateful for the opportunity to travel,
and I can't wait to see where my next adventure takes me.